Dashboard
The RouteReporter Dashboard provides actionable insights into your fleet’s recent on-road activity and safety events. At a glance, you can view up-to-date information about route deviations and potential cost savings, including:
-
Excessive mileage
-
Higher than planned toll costs
-
Out-of-Route mileage
-
Excessive duration
-
Safety events (speed, rollover, and low-bridge warnings)
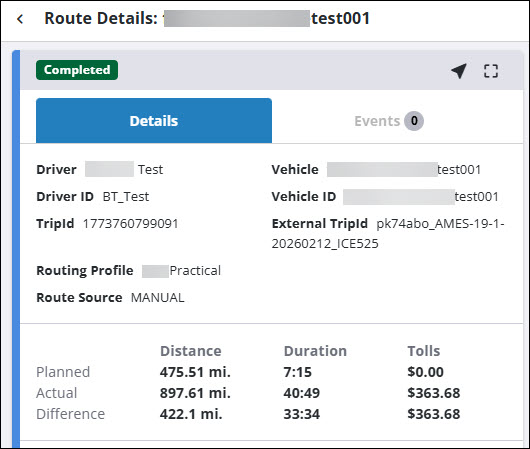
It also enables you to drill down and extract detailed insights for the worst offending routes.
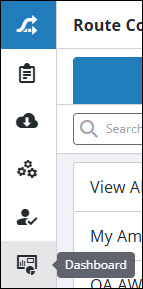
To view the Dashboard, select Dashboard from the left navigation menu.
Dashboard timeframe
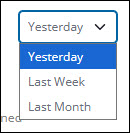
When you open the Dashboard, you will see a series of cards that summarize key metrics for your fleet’s recent activity. It defaults to data from Yesterday, but you can use any of the drop-down filters to switch to data from Last Week or Last Month. Switching the timeframe will update the data for all of the cards.
Dashboard cards
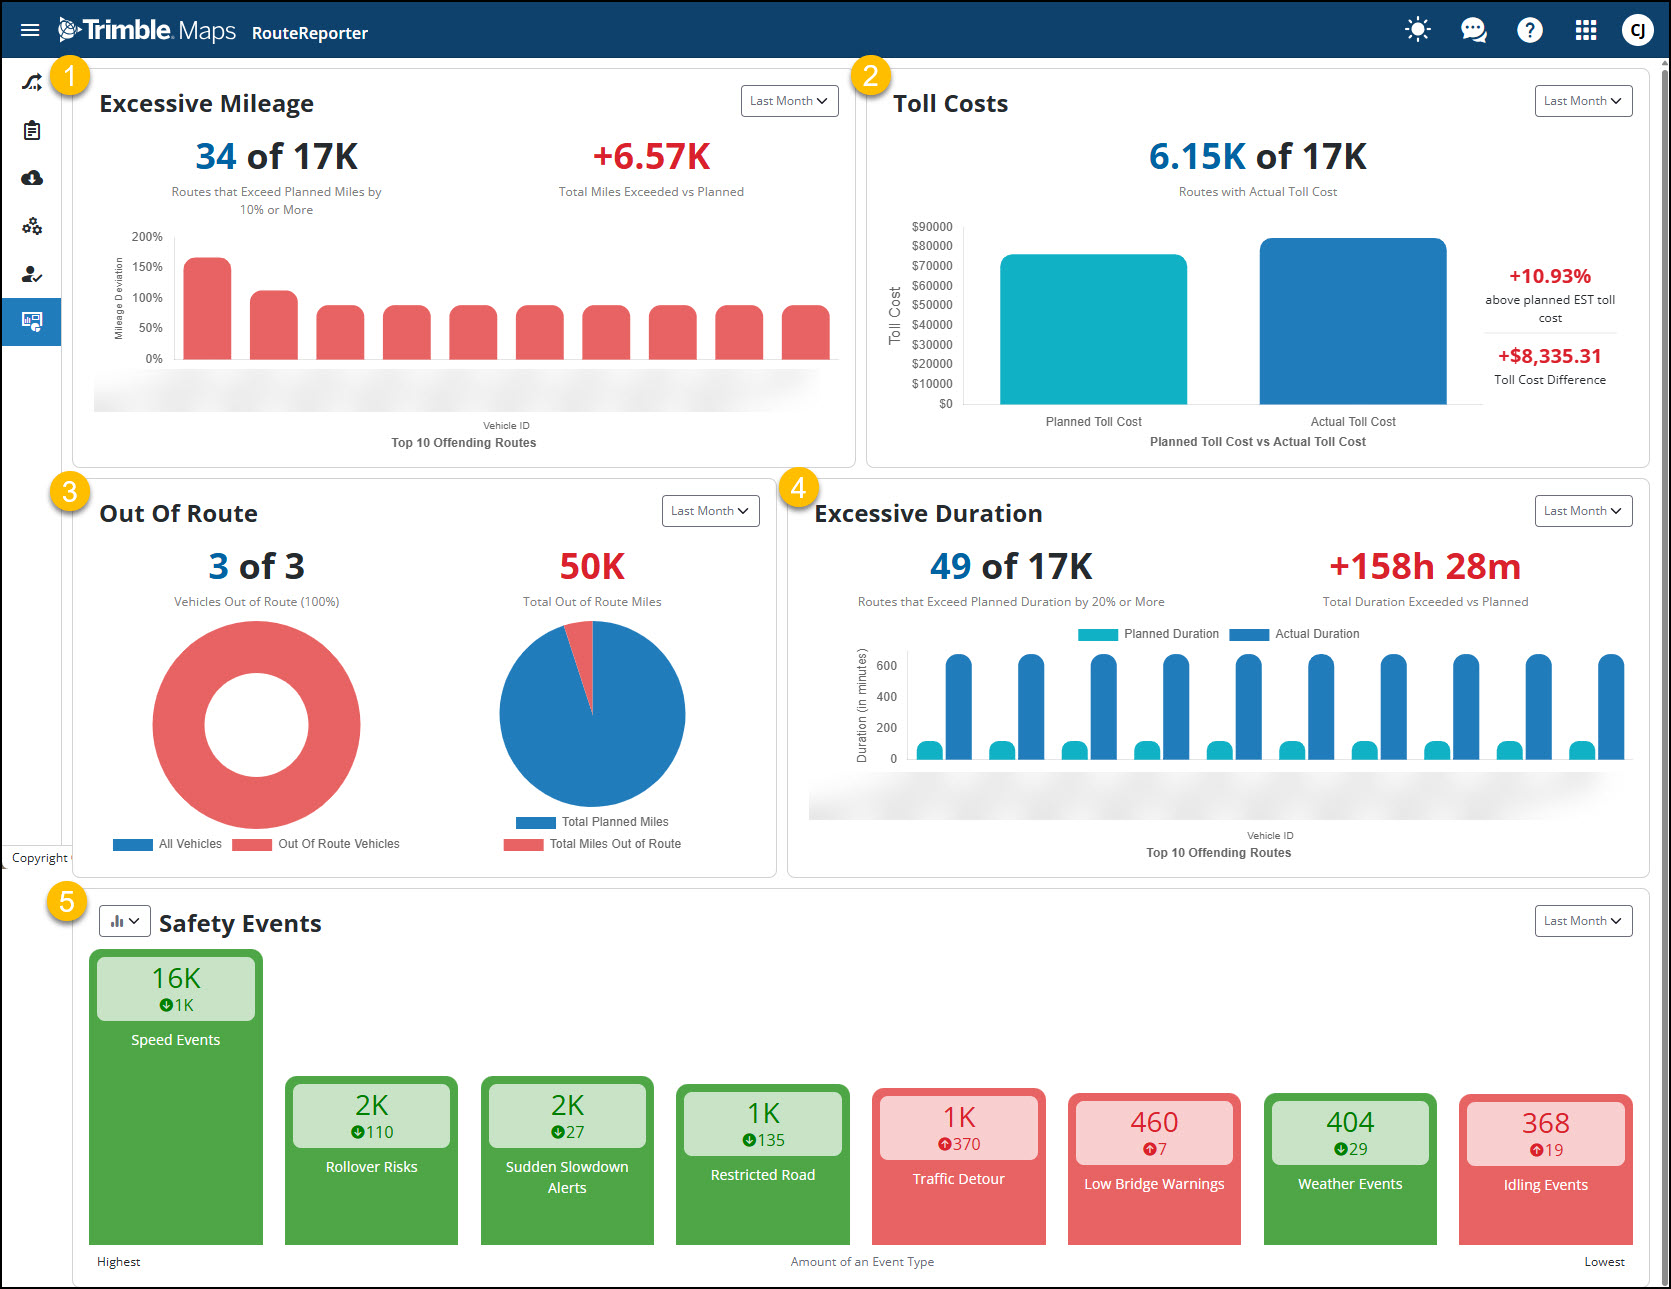
-
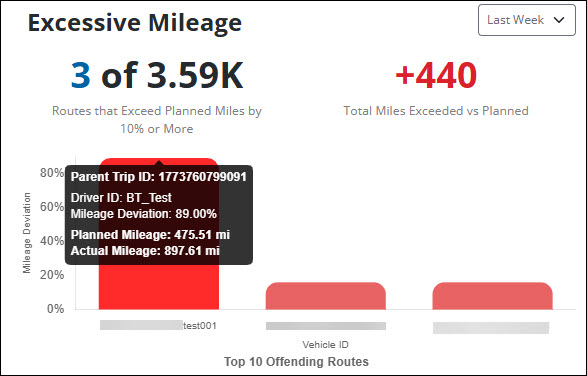
Excessive Mileage shows the number of routes where the actual mileage exceeded the planned mileage by more than 10%, and the total excess mileage across all routes.
-
Toll Costs shows planned toll costs vs. actual toll costs for all routes.
-
Out of Route shows the number of routes where the driver went out of route as well as the total out of route mileage. Out of route mileage accounts for only the distance driven outside of the Out of Route Threshold set in Account Manager. The threshold is the air distance between the actual route and the planned route, and it accounts for minor deviations that may occur during normal driving. (This threshold is why Out of Route mileage and Excessive Mileage are different.) If the driver goes outside of this threshold, it is considered an out of route event.
-
Excessive Duration shows the number of routes where the actual duration exceeded the planned duration by more than 20%, and the total excess duration across all routes.
-
Safety Events shows the number of routes with safety events, including speed warnings, rollover warnings, and low-bridge warnings.