Layout of the Bid Home page
The Bid Home page contains the following sections and buttons.
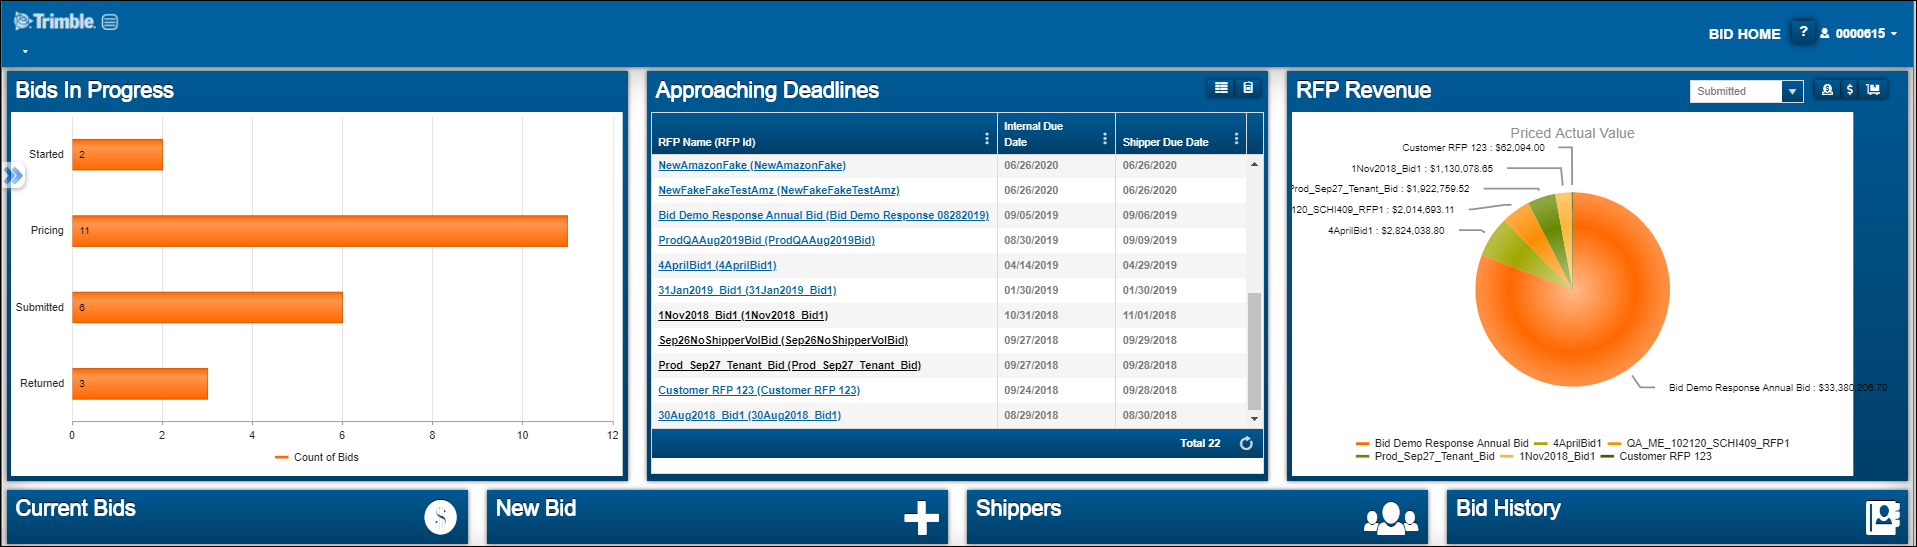
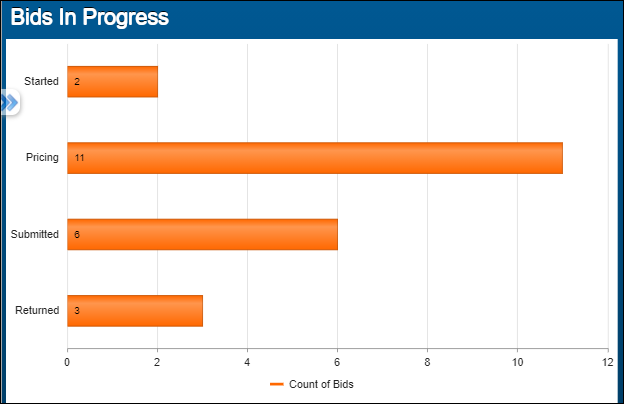
Bids in Progress
The Bids in Progress section displays the number of bids in each of these status groups:
-
Started
An RFP has been created in Engage.Bid for visibility purposes. No RFP has been uploaded. -
Pricing
An RPF has been uploaded and is currently in the pricing phase. It has not yet been submitted to the shipper. -
Submitted
A response has been generated in Engage.Bid for sending to the shipper. -
Returned
The shipper has provided a response file for the current pricing round. This file has been uploaded to Engage.Bid against the RFP.
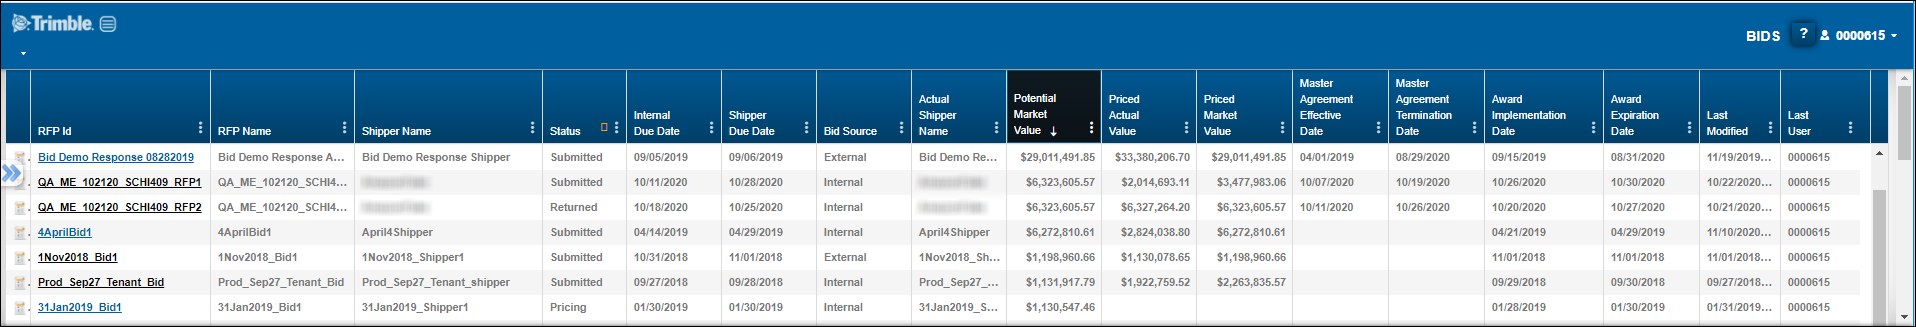
Clicking on a bar in the chart opens the Bids page with bids that meet the selected bid status. For example, clicking on the Returned bar displays returned bids on the Bids page.
Note: The Status filter on the Bids page includes these additional statuses not found on the Home page:
-
Approved
-
Published
-
Completed
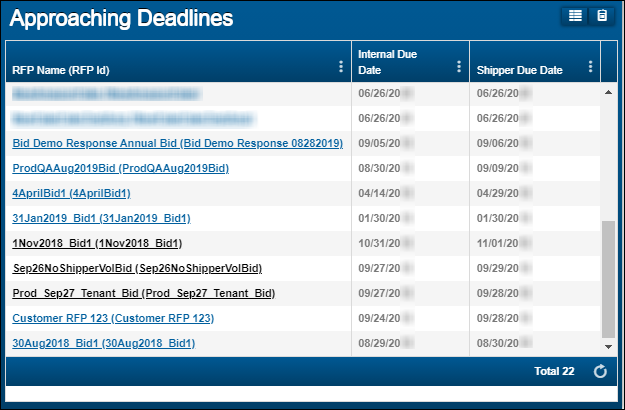
Approaching Deadlines
The Approaching Deadlines section shows all active, incomplete RFPs. For each RFP, an internal and external due date appears. You can view information in a list (default) or a calendar.
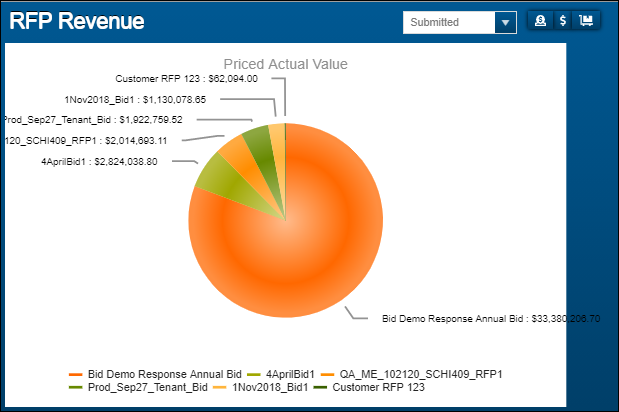
RFP Revenue
The RFP Revenue section shows a pie chart showing total revenues per bid. There are two types of filters you can use to create different views of the data. The two filter types work together.
You can filter by bid status.
Use the status field at the top of the section to filter the view by bid status:
-
Submitted
-
Returned
-
Pricing
-
Completed
You can also filter by revenue type.
The three buttons to the right of the status field let you specify the type of revenue used to calculate the chart.
-
Priced Actual Value (first button reading left to right)
The actual value of the lanes priced by the carrier
Calculated as [Bid RPM (the carrier’s rate)] x [Bid Volume (the carrier’s volume)] -
Priced Market Value (second button reading left to right)
The market value of the lanes priced by the carrier
Calculated as [Bid Volume (the carrier’s volume)] x [MRI (the lane’s Market Rate Index)] -
Potential Market Value (third button reading left to right)
The revenue available in the RFP (lane file)
Calculated as [Shipper Volume (expected annual orders)] x [MRI (the lane’s Market Rate Index)]
Current Bids
Click Current Bids to open the Bids page. It lists all incomplete bids.
|
You can also access the Bids page by clicking |
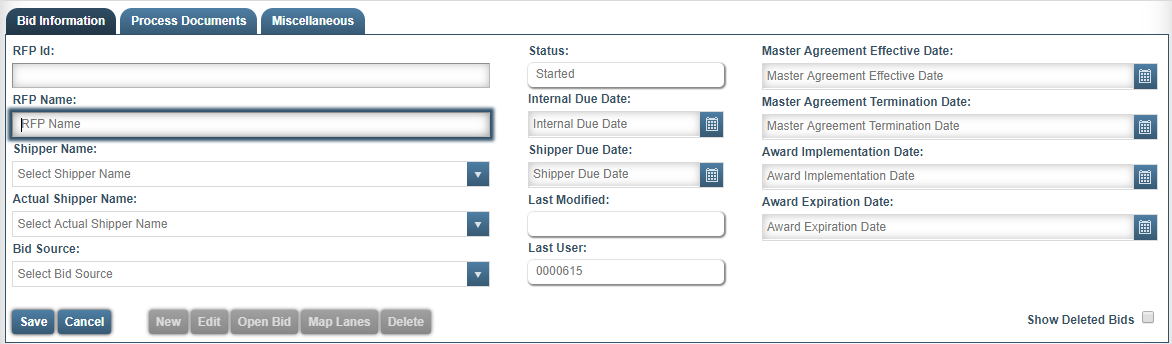
New Bid
Clicking New Bid displays the Bids page and activates the fields on the Bid Information tab.
|
You can also access these fields by clicking |
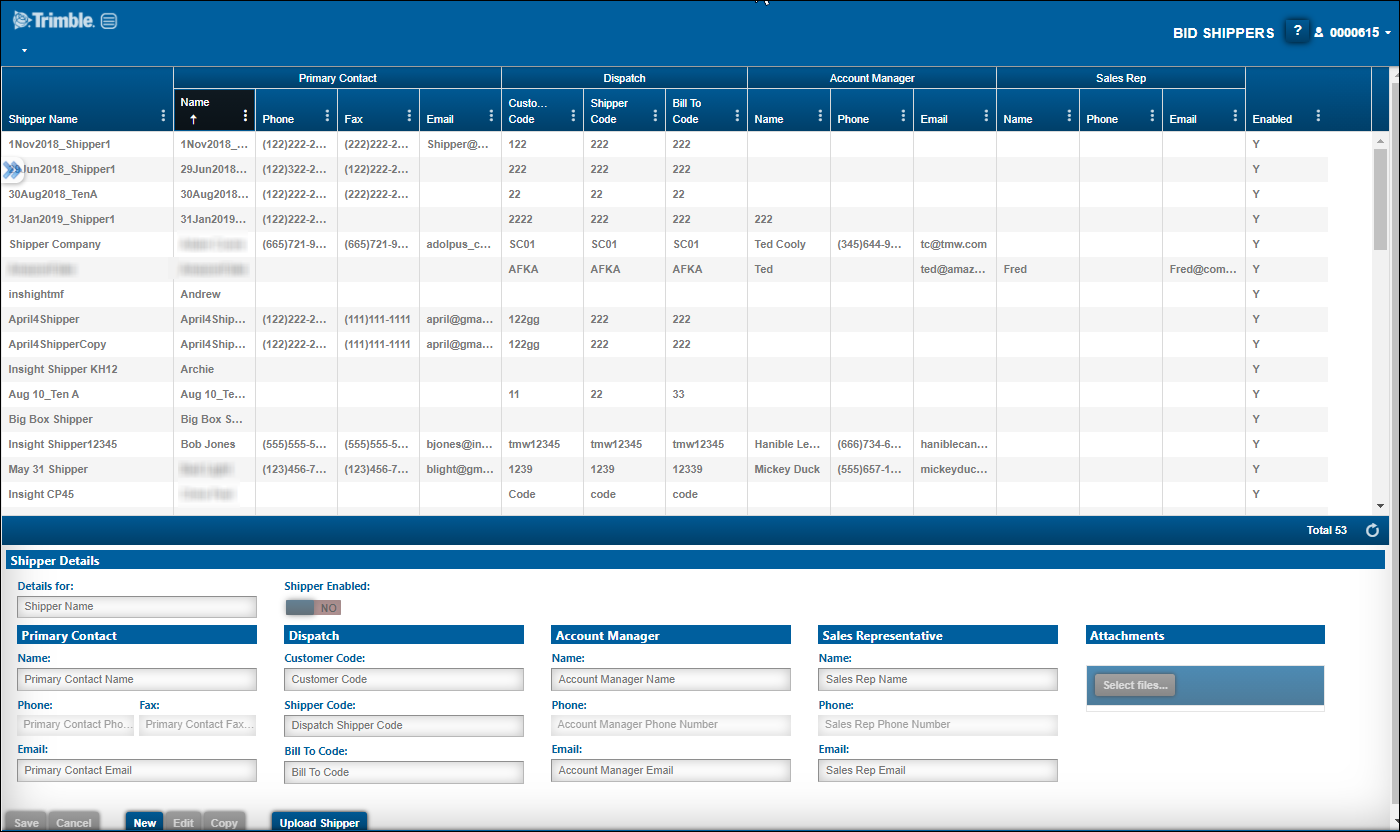
Shippers
Click Shippers to display the Bid Shippers page. It lists all shippers in the system.
To view a shipper’s details, click its row in the grid. The Shipper Details section at the bottom of the page shows the details.
You also enter new shippers on this page.
|
You can also access the Bid Shippers page by clicking |
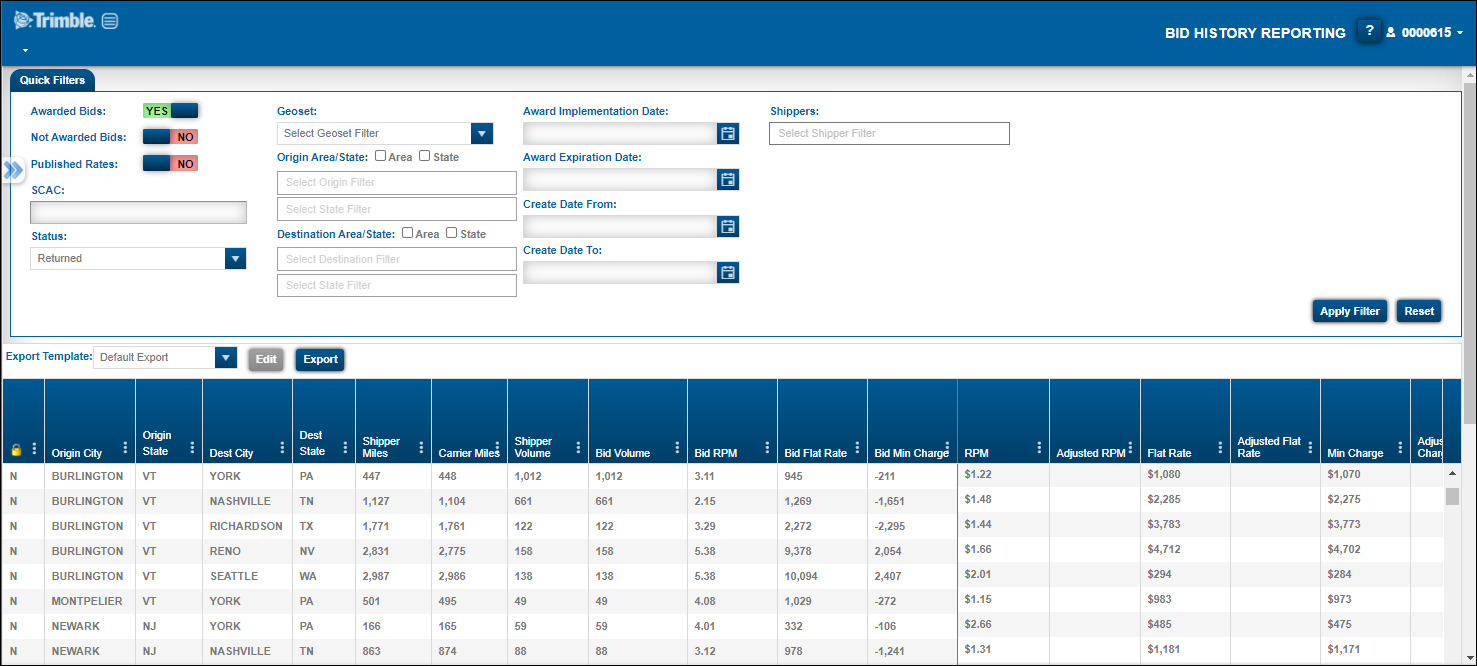
Bid History
Click Bid History to display the Bid History Reporting page. You can set filters on the Quick Filters tab to restrict the bids retrieved.
|
You can also access the Bid History Reporting page by clicking |