Reviewing model data
The Review Sales History window in Inventory Services displays a daily history of readings, orders, sales, and deliveries for up to 10 tanks (commodities) at a store.
The Review Sales History window consists of a header, and individual tabs for:
-
Daily tank readings
-
A graphic representation of readings plus deliveries for each tank
-
Sales
-
Orders numbers
-
Sales trend summaries, per commodity
-
Activity log, per commodity
In the Readings tab, you can change the information in the ReadingDate and Reading fields. All other fields in the tabs are read-only.
Retrieving a store’s sales history
During a holiday or special event, a gas station may sell greater or lesser amounts of fuel. Inventory Services stores all historical sales data. You can use this data to generate sales reports. This information will help dispatchers anticipate consumption patterns and identify sales trends. It will also allow them to reduce retains and runouts due to date or event-related forecasting issues.
Use fields in the Review Sales History window’s header section to enter a store ID, start date, and end date for the sales history data you want to retrieve.
These fields in the window header are used to retrieve data:
Company |
Enter the store’s primary ID, as recorded in its profile. Note: Alternatively, you can use the Alt ID field to specify the store for which you are retrieving sales history. |
Alt ID |
Enter the store’s alternate ID of the store. Note: An alternate ID can be recorded for a company in its profile. |
Start |
Enter the start date for the report period displayed in the Review Sales History window. Notes:
|
Lock Start Date |
After you set the Start date, select the checkbox to retain that date as the default start date. The Start date will be read only until you clear the checkbox. |
End |
Enter the ending date for the report period displayed in the Review Sales History window. The field value defaults to the current date, but you can enter a different date, if needed. Notes:
|
Use Current Time |
Select the checkbox to use the current time for the Start and End fields. The specified date/time range appears to the right of the field.
|
The remaining fields are read-only. The system provides information based on the store ID you entered.
Name |
Name of the store |
Address1 |
Store’s street address |
City |
Store’s city/state location |
Phone |
Store’s phone number |
Comments |
Value from the CmpMisc1 field in the store’s profile |
To open the Review Sales History window:
-
Go to Maintenance > Review Sales History.
-
The End field defaults to four days earlier than the current date. To work with a different end date, change the date.
-
Enter the appropriate ID in the Company or Alt ID field, and press TAB.
-
Select the needed history tab.
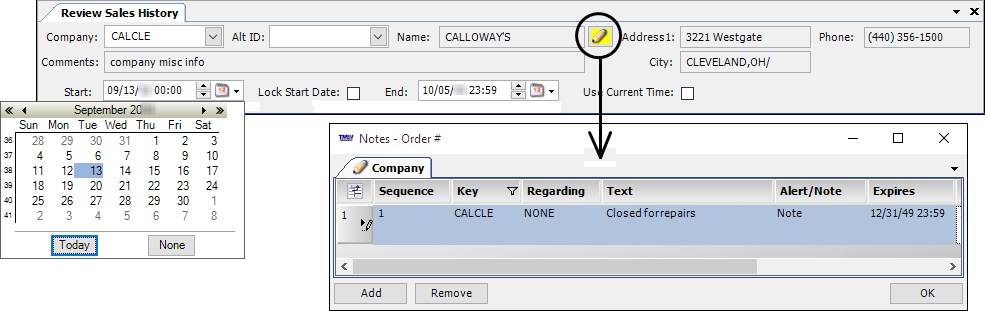
If a note or an alert has been recorded for the store, the Note indicator background color changes from gray  to yellow to yellow  or red or red  . Click the indicator to view notes recorded in the company profile’s Notes Order # window. Notes accessed in this window are read-only. . Click the indicator to view notes recorded in the company profile’s Notes Order # window. Notes accessed in this window are read-only.
|
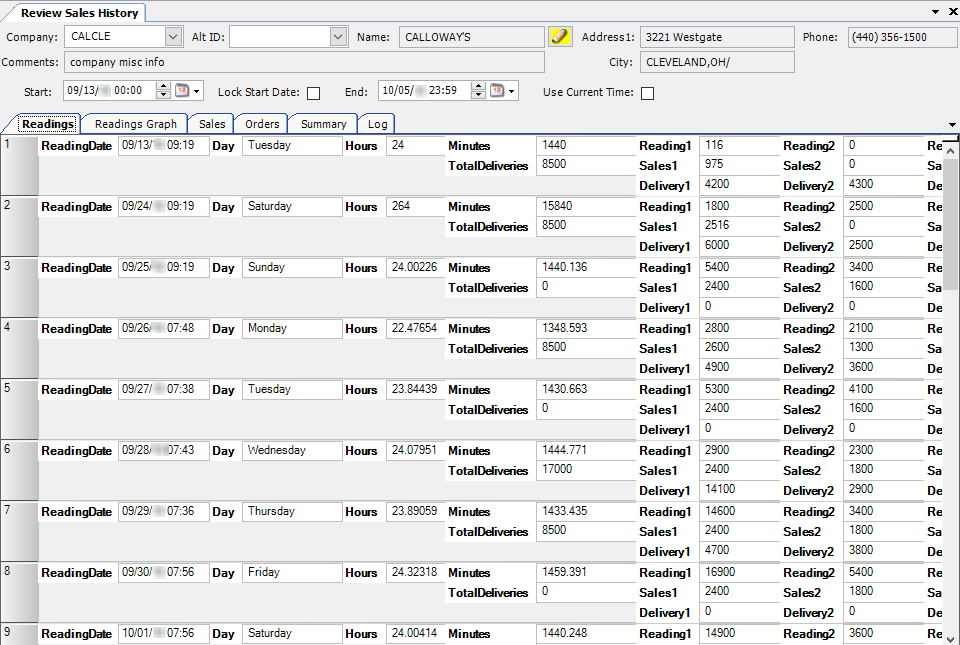
Understanding readings data
The Readings tab displays a grid of daily readings, orders, sales, and delivery data for up to 10 tanks at a store. Each day is represented by a row. Each tank’s data is represented by a column.
Each row displays the following information for a given day:
-
Reading date, time, and weekday
-
Hours since the previous reading(s)
-
The order numbers of the orders to be delivered
-
Total volumes of deliveries and sales
-
Readings, sales, and deliveries, per tank
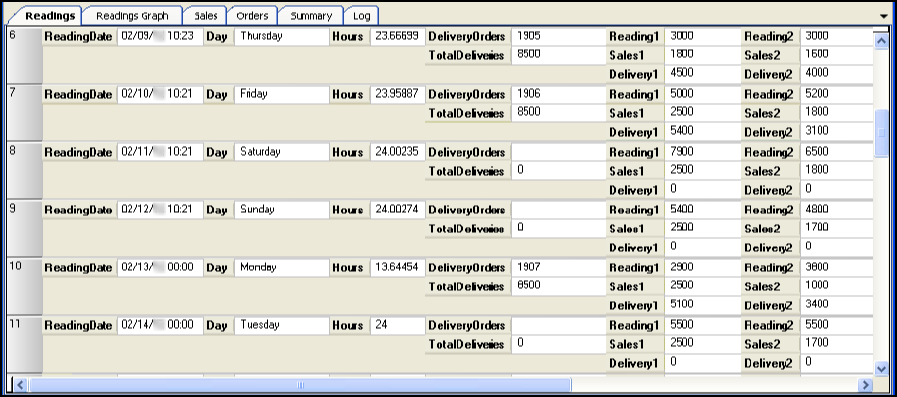
All fields are read-only.
ReadingDate |
Date and time of a group of tank readings |
Day |
Weekday on which the tanks were read |
Hours |
Number of hours between a set of tank readings and the previous set of tank readings (the earlier adjacent row) |
TotalSales |
Sum of the sales columns (Sales1 + Sales2 … Sales10) for a given date and time Note: By default, this field is hidden. Use the Field Chooser to make it visible. |
TotalReadings |
Sum of the reading columns (Reading1 + Reading2 … Reading10) for a given date and time Note: By default, this field is hidden. Use the Field Chooser to make it visible. |
DeliveryOrders |
Order numbers scheduled to be delivered on the ReadingDate Note: If there are multiple order numbers, they are separated by commas. |
TotalDeliveries |
Sum of the delivery columns (Delivery1 + Delivery2 … Delivery10) for a given date and time |
Reading1-Reading10 |
Readings for tanks 1-10 for a given day and time |
Sales1-Sales10 |
Amount of product pumped from a tank (1-10) for a given date and time |
Delivery1-Delivery10 |
Deliveries for tanks 1-10 for a given date and time |
|
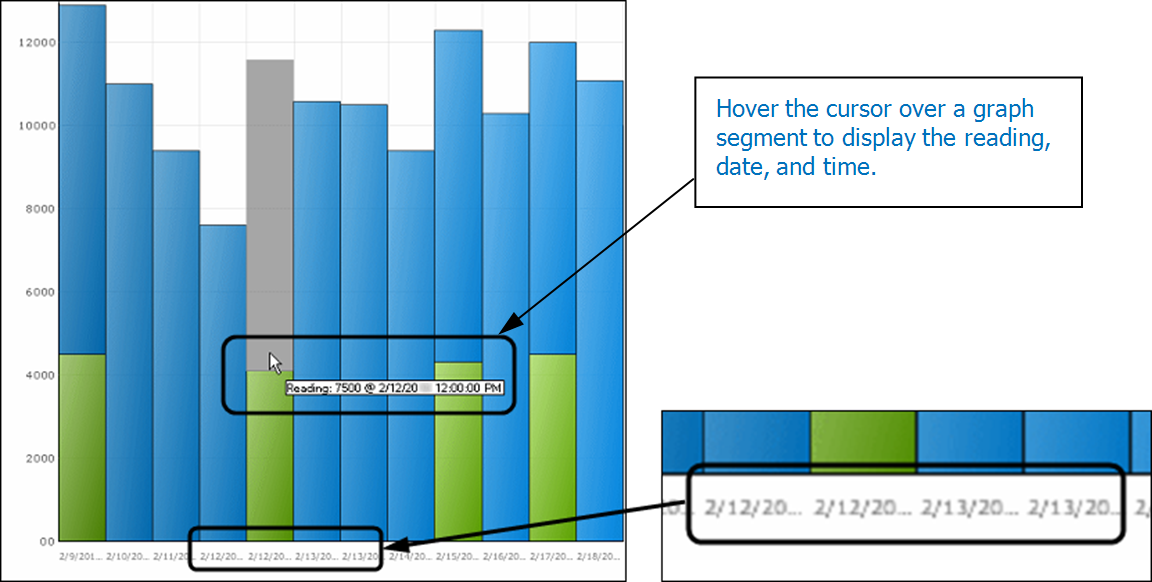
Viewing the readings and deliveries graph
The Readings Graph tab displays readings and delivery amounts, per day, for up to 10 tanks at a store. All fields are read-only.
A graph for Tank 1 is displayed by default. Use the radio buttons at the top of the graph to select Tank 2- Tank 10 as needed.
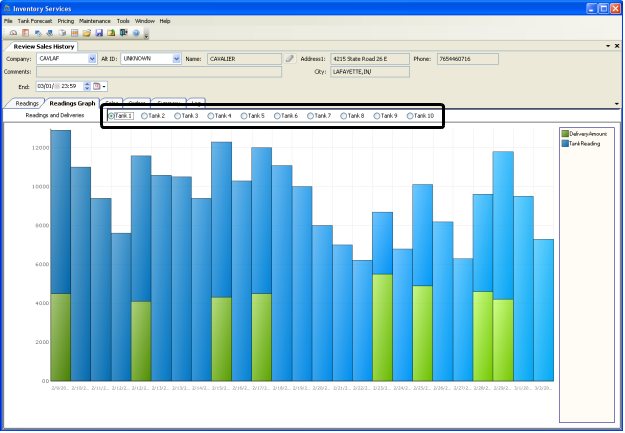
A bar can represent a delivery amount and a reading amount. Delivery amounts are shown as a green bar segment. Reading values are shown as a blue segment. It is possible for a bar to consist of only one segment.
-
The graph’s vertical (Y) axis displays the total volume (delivery + reading) of product in the tank.
-
The graph’s horizontal (X) axis shows the date and time corresponding to each bar.
-
If there are multiple readings and/or deliveries for a tank on a given day, there are multiple bars side by side for that day.
-
Placing the cursor over a graph segment displays the volume, date, and time of the reading or delivery.
Understanding sales data
The Sales tab displays product sales for each tank as of the displayed day and time. Product sales are quantities pumped from a tank.
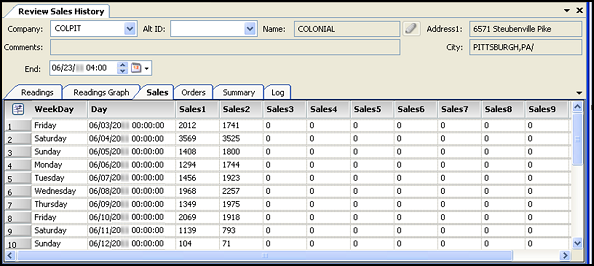
All fields are read-only.
WeekDay |
Weekday (Sunday-Saturday) corresponding to the date shown in the Day column |
Day |
Date and time corresponding to the sales made from each tank (Sales1-Sales10) |
Sales1 - Sales10 |
Volume of each commodity (tanks 1-10) sold by the store on a given date, as of the displayed date and time |
Understanding orders data
The Orders tab displays product quantities delivered to a tank on a given date and time. If multiple orders exist for a given day, each order number is shown in a separate row.
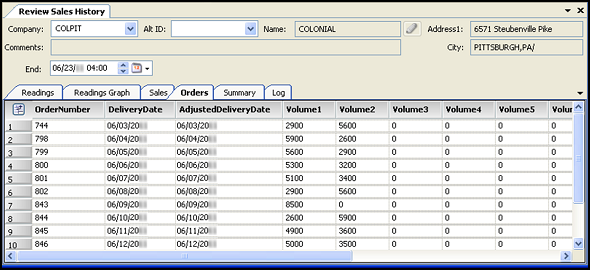
All fields are read-only.
OrderNumber |
Order ID number |
DeliveryDate |
Order’s scheduled delivery date |
AdjustedDeliveryDate |
Date the Forecaster projects or has recorded as the actual delivery date |
Volume1-Volume10 |
Delivered volume of a particular commodity on the order |
TotalVolume |
Sum of all commodities (Volume1 + Volume2 + … Volume10) delivered on a given delivery date Note: By default, the TotalVolume column is located at the right of the grid. |
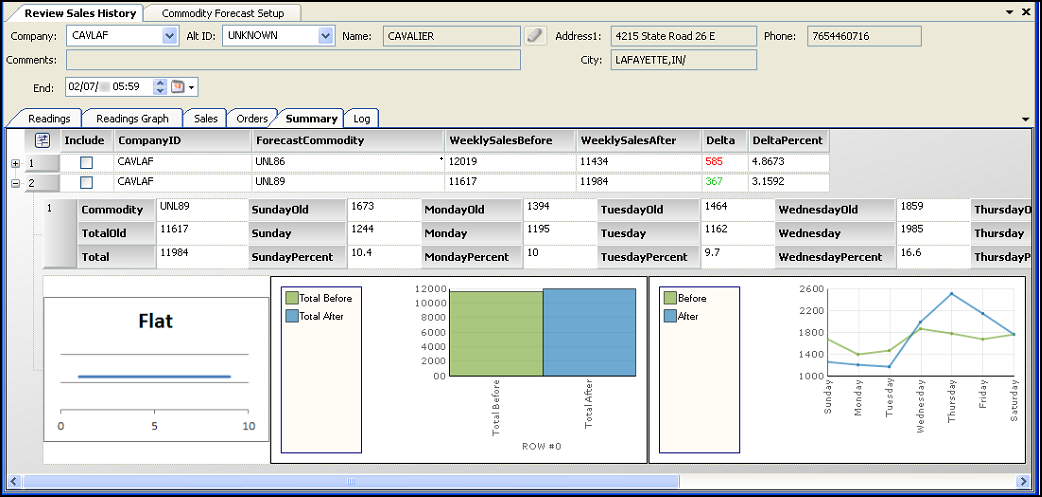
Understanding the data summary
The Summary tab compares a tank’s total sales for the week before and the week after the date in the End field.
The tab includes a calculation of delta volume and delta percent. You can view additional daily sales figures and trends for a commodity by clicking ![]() Expand in its row.
Expand in its row.
All fields are read-only.
Commodity |
Commodity ID |
WeeklySalesBefore |
Weekly sales before the date displayed in the End field |
WeeklySalesAfter |
Weekly sales after the date displayed in the End field |
Delta |
Calculated as: ( WeeklySalesAfter - WeeklySalesBefore ) A negative change appears in red. A positive change appears in green. |
Delta Percent |
Calculated as: [(WeeklySalesAfter - WeeklySalesBefore)/WeeklySalesBefore] x 100 |
Total |
Total sales of the commodity for the period ending on the End date The total is calculated as the sum of sales displayed for Sunday through Saturday. |
TotalOld |
Sum of volumes for SundayOld through SaturdayOld |
SundayPercent - SaturdayPercent |
Calculated as: ( Sales for an individual day / Total ) x 100 |
Sunday - Saturday |
Daily sales for each weekday, as of the End date |
SundayOld - SaturdayOld |
Daily sales according to the product’s current sales model |
Understanding the summary graphs
When you expand a tank’s row, it displays daily sales details and graphs for the tank.
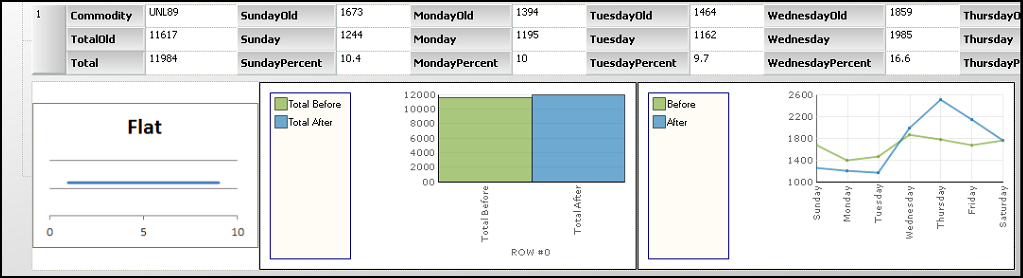
Individual graphs include:
-
The Forecast Sales Update Rule
The left graph displays the Forecast Sales Update Rule selected for the tank in the Commodity Forecast Setup window. Rule graphs include:-
Flat
All weights are the same. This is the same as taking the average without weighting.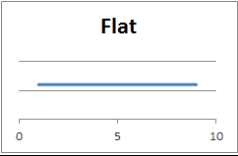
-
Standard
Weights are decreased in a uniform fashion (X-1, X-2, X-3…).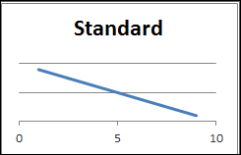
-
Half Life
Each week is 50% more important than the next (X/2, (X/2)/2, (X/2)/(X/2)/2, etc.).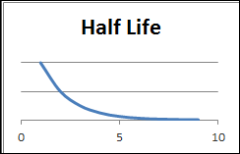
-
Base 10
Each week is 10 times more important than the next (next (X/10, (X/10)/10, (X/10)/(X/10)/10, etc.).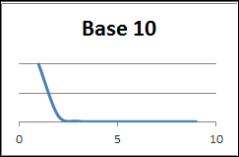
-
-
Total Weekly Sales
The center graph displays total sales for the weeks before and after the date entered in the End field. The bars correspond to TotalOld and Total.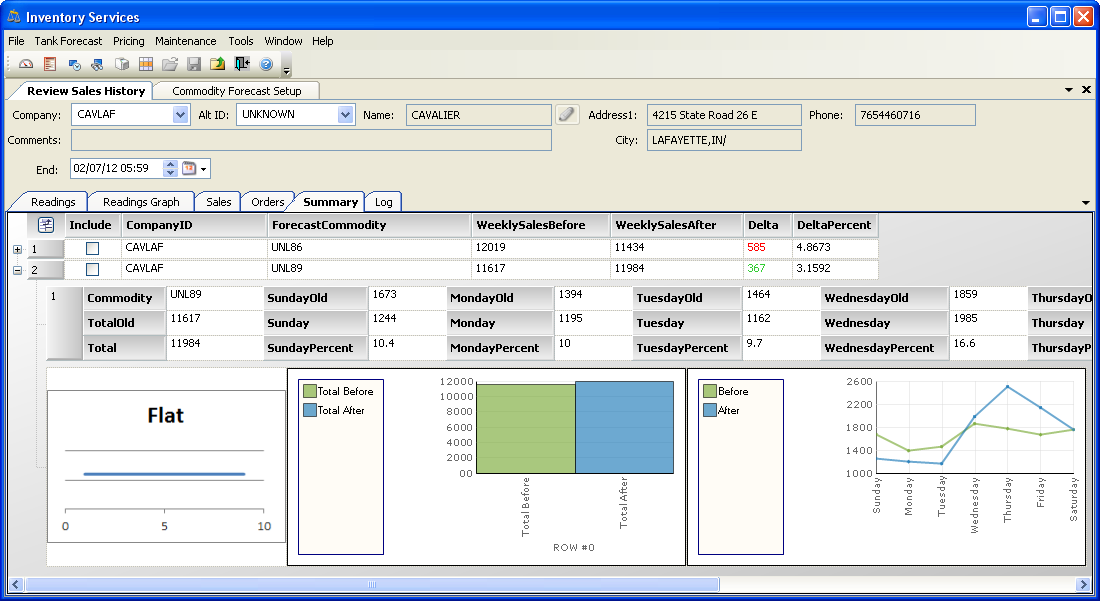
-
Daily sales trends
The right graph displays daily sales trends for the weeks before and after the date entered in the End field. The graphs correspond to SundayOld-SaturdayOld and Sunday-Saturday.
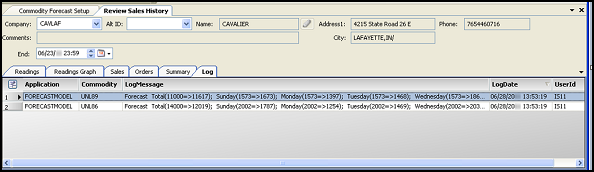
Understanding Forecaster log data
The Log tab records the activity of the Forecaster.
All fields are read-only.
Application |
Application (Forecaster) that performed the logged activity |
Commodity |
ID of the commodity that was affected by the logged activity |
LogMessage |
Summary of the logged activity For the Forecaster, these changes are daily updates of the sales forecast. |
LogDate |
Date and time the log entry was recorded |
UserID |
ID of the user who performed the logged activity |