Comparing the Sales Model to actual sales
Once you have had Inventory Services set up and running for a while, you may want to compare the actual sales of a product to its sales model. Based on the comparison, you may need to update the sales model. The update can be a straight replacement of the model with actual sales data, or you can update it with sales data you have modified.
In an ideal situation, a sales model’s predictions would agree completely with real-world sales, and the model could be relied upon to generate orders with correct volumes and timely delivery for every store and product. In practice, factors such as sales model setup assumptions, unpredictable fluctuations in demand, and incorrect readings can limit a model’s accuracy. Over time, the Sales Model Update Comparison window lets you fine-tune a sales model to improve its agreement with actual sales.
To access the window, go to Maintenance > Sales Model Update Comparison. The window consists of a header and a grid.
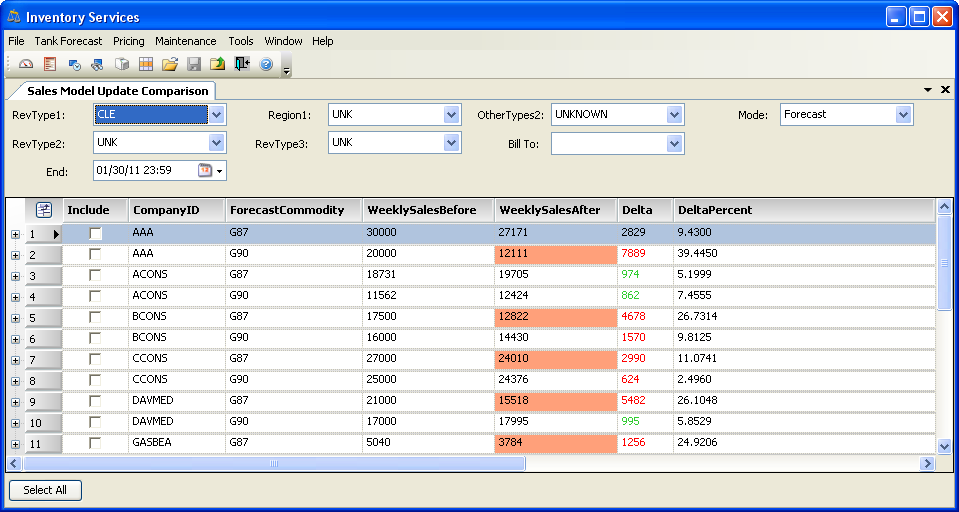
The header contains fields used to set restrictions on the data you retrieve. The grid displays a row for each store’s commodities. Each commodity has its own, independent sales model. You can expand each row to view forecasted and actual sales data daily, and by total.
Retrieving data
To retrieve sales model data, follow these steps.
-
Go to Maintenance > Sales Model Update Comparison.
-
Make entries in the following fields to restrict the data retrieved.
RevType1-3
Revenue classifications to which the company has been assigned in its profile
Note: The field names and options are set up in the RevType 1-3 labels in the System Administration application.
Region1
Dispatch region designation for the place where the driver is currently located, or (for a driver with an On the Road dispatch status) where he will finish his current trip
Note: Dispatch regions are set up in the System Administration application.
OtherTypes2
Company classifications to which the company has been assigned in its profile
Note: The field names and options are set up in the OtherTypes2 label in the System Administration application.
Bill To
Displays a company if the Bill To checkbox is selected in the company’s profile. For information about setting up company profiles, see: Guide: File Maintenance | Chapter: Company File Maintenance
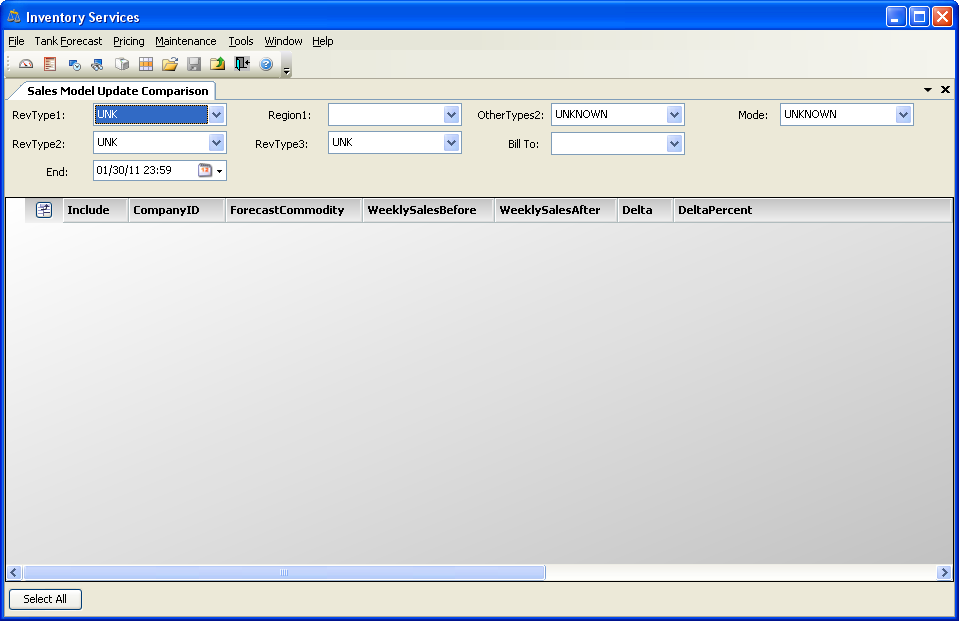
Mode
To enable the grid to display data, leave the field as UNKNOWN, or select Forecast.
Note: Mode options are system codes required by the application. They can be viewed in the InventoryServiceMode label in the System Administration application. System codes should never be changed or deleted. Additionally, you should not add options to the label.
End
Enter the ending date for the sales data you want to see displayed in the grid. The number of days' worth of data displayed is based on this date, and the number of weeks recorded for the commodity in the Commodity Forecast Setup window’s Weeks Included field. To view the commodity’s forecast setup, select Maintenance > Commodity Forecast Setup.
-
Click
 Open.
Open.
The grid displays data matching your restrictions.
Viewing a data summary for a store’s tank
When data is first retrieved, the grid shows summary information for all forecasted commodities at each store matching your retrieval restrictions.
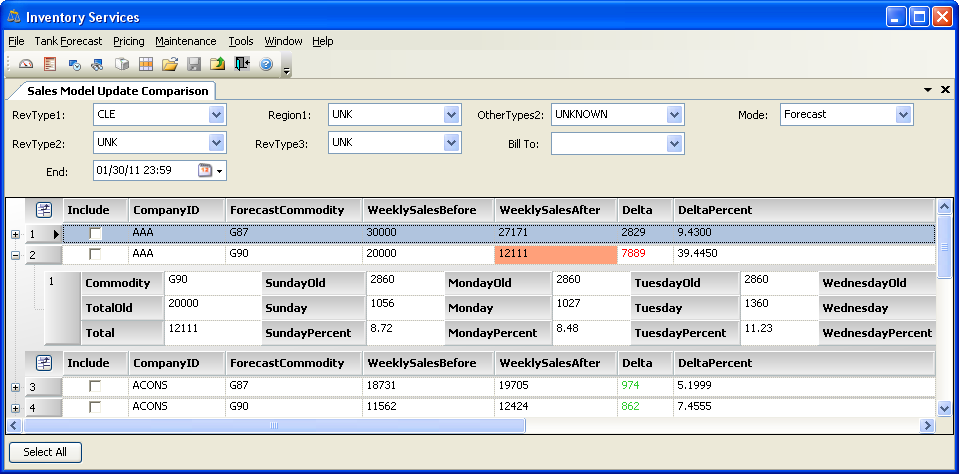
When a row is expanded, you can see the sales model and sales performance for that product.
To review sales data, use this procedure:
-
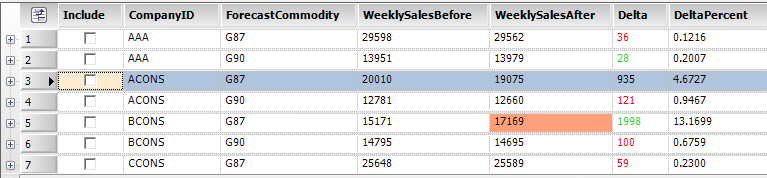
If you want, you can sort the grid by clicking the appropriate header. A suggested sort key is DeltaPercent. This sort lets you focus on large and small differences between the sales model and actual sales.
-
For a given product, compare the forecast sales model (WeeklySalesBefore) to actual sales (WeeklySalesAfter). The differences are summarized by the Delta (quantity) and DeltaPercent fields.
-
To view daily figures for the product, click
 Expand. You can then compare the daily forecast model (SundayOld - SaturdayOld) with daily sales (Sunday - Saturday).
In the following definitions, all fields are read-only unless noted otherwise.
-
Denotes fields that are viewable when a row is expanded.
Include
Mark a product’s current sales model for replacement by actual sales data.
CompanyID
ID of the consignee company (store)
ForecastCommodity
ID of the commodity
WeeklySalesBefore
Total weekly sales predicted by the product’s current sales model
The same figure is displayed in the TotalOld field.
WeeklySalesAfter
Product’s total actual sales for the period ending on the End date
An orange background indicates the difference between WeeklySalesBefore and WeeklySalesAfter exceeds 10%. The same figure is displayed in the Total field.
Delta
Calculated as:
WeeklySalesBefore - WeeklySalesAfter
A positive difference is green; a negative difference is red.
DeltaPercent
Calculated as an absolute value:
(WeeklySalesBefore - WeeklySalesAfter) / WeeklySalesBefore
The result is expressed as a positive percentage.
Commodity
ID of the commodity
TotalOld
Weekly total sales predicted by the product’s current sales model
It is equal to the sum of SundayOld through SaturdayOld. The same figure is displayed in the WeeklySalesBefore field.
Note: The displayed TotalOld value might differ by a fraction of a percent from the sum of SundayOld through SaturdayOld. This difference can result from percent rounding used in calculations, or from manual sales entries.
Total
Product’s total sales for the period ending on the End date
It is equal to the sum of sales displayed in the Sunday through Saturday fields. The same figure is displayed in the WeeklySalesAfter field.
SundayOld - SaturdayOld
Predicted daily sales according to the product’s current sales model
Sunday - Saturday
Actual daily sales for each weekday, as of the End date
These fields can be edited.
SundayPercent - SaturdayPercent
Calculated as:
Actual sales for an individual day (Sunday, Monday,…Saturday) divided by the Total figure.
-
-
To collapse the row of daily figures, click
 Collapse.
Updating sales data
After comparing current sales data with the Sales Model data, you may want to update the Sales Model for some products. The replacement data can be the unedited sales figures for Sunday - Saturday, or edited quantities based on these figures. The decision to update the model, and the method you use, depends on your company’s policies and understanding of sales conditions.
Here are two possible approaches to interpreting the data:
-
DeltaPercent values of a few percent or less
DeltaPercent values of a few percent or less indicate the model and sales are in reasonable agreement. If DeltaPercent values are consistent from week to week, it might be appropriate to replace the sales model with actual or slightly modified sales figures.
-
DeltaPercent values greater than a few percent
DeltaPercent values greater than a few percent, or that fluctuate widely, might indicate problems with the initial sales model, unexpected changes in demand, reading errors, or other conditions. These should be investigated.
Note: A significant difference between a sales model and actual sales can be caused by a single, random event. A recent event can make a sales model appear inaccurate, but the event’s influence will gradually disappear over time. In this case, you might choose to not update the sales model.
| Use care and good judgment should you decide to replace a product’s sales model with actual or modified Sunday - Saturday sales figures. |
To update a product’s Sales Model, follow these steps:
-
Click the
icon for a product to expand its row and view daily sales. -
If appropriate, modify the product’s Sunday - Saturday sales figures. If you do not, the model will be replaced with the product’s unedited sales figures.
-
Select the Include checkbox for that product.
-
If you want, click the
icon to collapse the product’s row of daily figures. -
Click
 Save.
Save.Note: The system does not request confirmation that you want to update the Sales Model. The update takes place immediately.
For each product that has the Include checkbox selected, sales figures in the Sunday - Saturday fields replace the product’s current sales model (SundayOld - SaturdayOld).
-
Repeat Steps 2-6 for other products you want to update.
The sales model and actual sales will now be the same. Future sales will affect the Sunday - Saturday fields, so the sales model and current sales figures can again differ.