SQL Query Analysis Agent
SQL Query Analysis Agent is a tool that uses artificial intelligence combined with DB2 explain plan analysis to:
-
Review your SQL statements
-
Identify performance bottlenecks
-
Suggest improved versions of your queries
Best practices
To use SQL Query Analysis Agent successfully, follow these best practices:
-
Always test optimized SQL in a development environment first.
-
Compare both the original and optimized SQL results to make sure they are identical.
-
Do not apply AI recommendations without first understanding the changes.
-
For production-critical queries, have a peer review the AI recommendations.
-
Re-run the analysis periodically on frequently-used queries as data grows.
-
Pay special attention to queries with Critical or Extreme severity ratings.
-
Use CPU cost thresholds to catch performance issues during development.
Limitations
SQL Query Analysis Agent does not:
-
Automatically update your SQL in production
-
Guarantee that optimized SQL will always be faster. Always test!
-
Work offline
-
Analyze stored procedure logic. It only analyzes SQL statements.
-
Modify your database schema or create indexes
-
Optimize DML (Data Manipulation Language) statements (INSERT, UPDATE, DELETE). It focuses on SELECT queries.
Setup
To use SQL Query Analysis Agent:
-
Your workstation must have internet access to reach the AI service endpoint.
-
You must set up several application configuration options (app configs). If these are not set up, the
 Test SQL button will not trigger AI analysis.
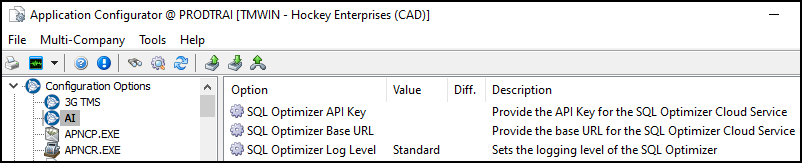
Set AI application configuration options
There are three app configs in the AI section of Application Configurator:
-
SQL Optimizer Base URL must be set to a valid AI service endpoint.
-
SQL Optimizer API Key must contain valid authentication credentials.
-
SQL Optimizer Log Level sets the logging detail. Standard is recommended.
To get the values required for the SQL Optimizer Base URL and SQL Optimizer API Key app configs, contact Trimble Transportation Support. If you do not have an account, you can create one by selecting Sign Up.
Set a max query cost
In the TRACE.EXE section of Application Configurator, the Max Query Cost config sets the CPU cost threshold in timerons.
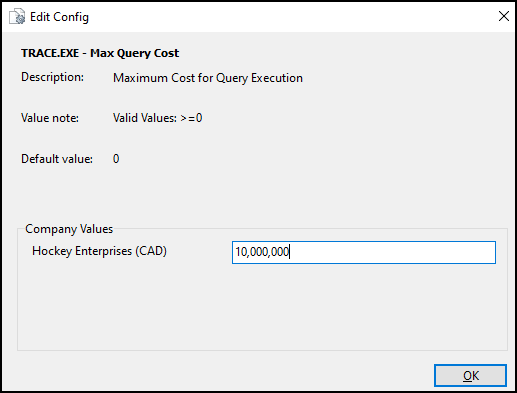
When queries exceed this threshold, the agent displays severity-based warnings. The recommended setting is 10,000,000 timerons for production environments. This may need to be adjusted based on database size.
|
Timerons are DB2’s estimate of the computational resources your query will consume. Timerons represent a combination of:
|
Use SQL Query Analysis Agent in WatchDawg
WatchDawg is TruckMate’s tool for managing scheduled SQL queries and stored procedures that run automatically. Because these schedule queries repeat regularly, even small performance improvements compound over time. Poor-performing scheduled queries can slow down the entire system during business hours.
Here is an example optimization for report that runs every hour:
-
Original execution time: 45 seconds
-
Optimized execution time: 15 seconds
-
Report runs 24 times a day
-
Result after optimization: 12 minutes of database CPU time saved per day adds up to 6 hours saved per month.
Here is an example optimization for a daily data export:
-
Original CPU cost: 250,000 timerons
-
Optimized CPU cost: 75,000 timerons
-
Report runs once daily during business hours
-
Result after optimization: Reduced risk of slow system performance during peak usage.
Submit a query for AI analysis
-
Open WatchDawg:
From this location Go to TruckMate Menu and TruckMate Task List
Reporting > The Dawg
Windows Start Menu
TruckMate > The Dawg
Windows Explorer
C:\Program Files (x86) > TruckMate > WatchDawg.exe
-
Use the navigation arrows or filters to open the WatchDawg record you want to optimize.
-
Select the SQL Statement tab and confirm the record has an SQL statement.
-
Select
Test SQL Statement on the toolbar. The system tests both the main SQL statement and the bursting SQL (if configured). A progress dialog opens and shows the analysis stages.If your query’s CPU cost exceeds the threshold, a performance warning opens.
-
Do one of the following:
-
If there is no performance warning, go to Step 7.
-
If there is a performance warning, review it and note the severity level. Critical and Extreme severity queries should be optimized before deployment
-
-
Select OK to acknowledge the warning and continue the analysis.
-
Select Optimize to send the query to the AI service.
The analysis typically takes 15-60 seconds, depending on query complexity. You can select Cancel at any time to end the analysis. You can continue working in other TruckMate windows while the analysis runs. The progress bar shows the completion percentage.
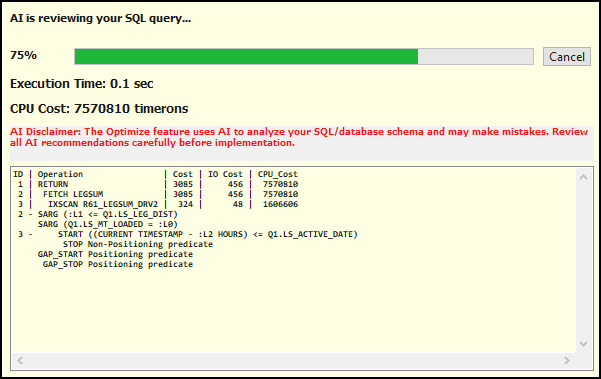
After the analysis completes, the SQL AI Analysis Results window opens.
-
Do the following to determine if you should apply the AI-recommended optimizations:
Apply optimizations in WatchDawg
If the AI recommendations show significant improvement, you can apply them to the WatchDawg record.
-
On the Optimized SQL tab, left-click in the Optimized SQL pane.
-
Select Ctrl+A to select all, then select Ctrl+C to copy.
-
Return to the WatchDawg record.
-
Select SQL Statement.
-
Left-click in the editable field on the SQL Statement pane.
-
Select Ctrl+A to select all, then select Delete.
-
Select Ctrl+V to paste the optimized SQL.
-
Test before saving:
-
Select
Test SQL Statement again to verify that it works. -
Check that results are identical to the original.
Note: Best practice is to test optimized WatchDawg queries in a development environment first. This is especially important for business-critical scheduled reports.
-
-
Monitor after implementation:
-
Check the WatchDawg execution logs for the next several runs.
-
Verify the execution time has improved.
-
Watch for any error messages or unexpected behavior.
-
Roll back to the original SQL if any issues occur.
Focus on consistent patterns across multiple test runs rather than single measurements. Execution times may vary between runs due to:
-
Database cache state
-
Concurrent system load
-
Data distribution changes
-
CPU cost estimates based on database statistics that may be outdated
-
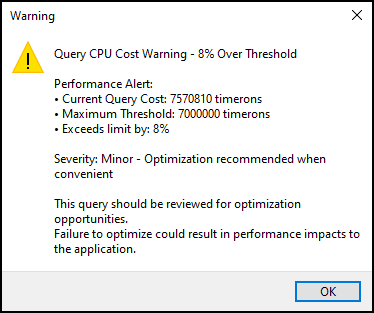
Interpret severity warnings
After you select Test SQL Statement, a performance warning will open if the query’s CPU cost exceeds your threshold.
Here are definitions for the warning:
| Warning dialog | Definition |
|---|---|
Current Query Cost |
Your query’s CPU cost in timerons |
Maximum Threshold |
The configured limit from the Query Cost Threshold config |
Exceeds limit by |
The percentage the query’s cost is over the threshold |
Severity |
|
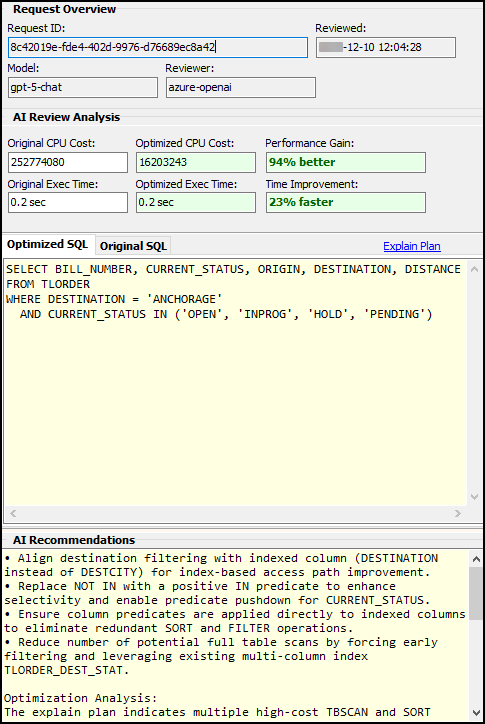
Review analysis results
The SQL AI Analysis Results window shows details about the original and the optimized SQL query. It has four sections:
Request Overview
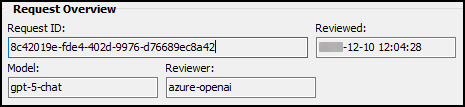
The Request Overview section shows details about the request itself.
| Field | Definition |
|---|---|
Request ID |
Unique identifier for the analysis (for audit trail) |
Reviewed |
Local time when the analysis was performed |
Model |
AI model version that was used (such as GPT-4o) |
Reviewer |
AI service identifier (such as Azure OpenAI) |
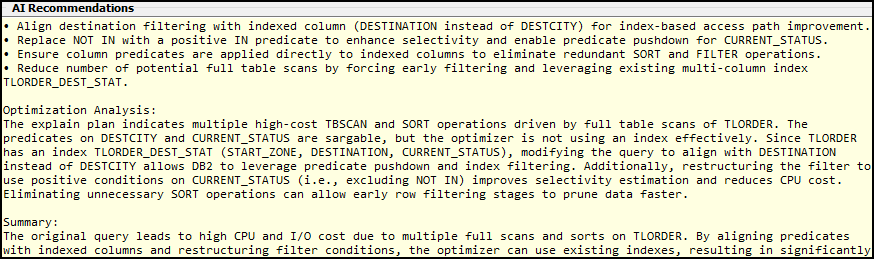
AI Review Analysis
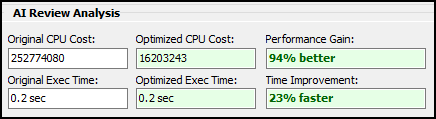
The AI Review Analysis section shows the cost and time of the original query versus the optimized query. Use these results to evaluate the optimization recommendations.
| Field | Definition |
|---|---|
Original CPU Cost |
Database’s estimated cost for your original query (timerons) |
Optimized CPU Cost |
Estimated cost for the AI-optimized query (timerons) |
Performance Gain |
Percentage improvement in CPU cost |
Original Exec Time |
How long the original query took to run |
Optimized Exec Time |
How long the optimized query took to run |
Time Improvement |
Percentage time saved by using the optimized query |
The AI Review Analysis fields use color coding:
-
Green text indicates the optimized query is faster.

-
Red text indicates the optimized query is slower.

-
Gray text is neutral. The optimized query’s performance is similar to the original query’s performance.

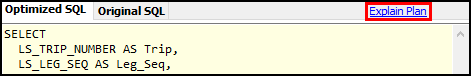
SQL and Explain tabs
The middle section shows the original and optimized query’s SQL and explain plans. You can toggle the tabs that are shown by selecting Explain Plan or SQL.
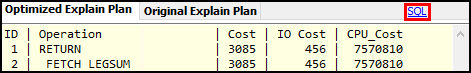
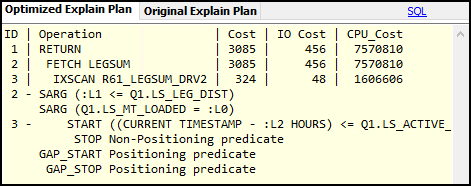
Explain plans
An explain plan shows how the database will execute your query, including table scans, index usage, join methods, and resource estimates. SQL Query Analysis Agent automatically executes DB2 explain plans for both your original and optimized SQL.
To view the explain plan, select Explain Plan. When you select this option, the Optimized SQL and Original SQL tabs are replaced by the Optimized Explain Plan and Original Explain Plan tabs.
Compare explain plans
You do not need to be an explain plan expert to choose the right plan. The AI recommendations explain the important differences in plain language. When comparing plans, look for these positive signs and warning signs in the optimized plan.
Positive signs:
-
IXSCAN (index scan) instead of TBSCAN (table scan)
-
Lower Cumulative Total Cost numbers
-
Fewer SORT operations
-
Smaller Estimated Rows counts
-
FETCH operations using indexes
Warning signs that indicate performance issues:
-
TBSCAN on large tables. Full table scans are slow.
-
Multiple SORT operations. Sorting is expensive.
-
TEMP (temporary table creation)
-
High Cumulative Total Cost numbers
-
Large Estimated Rows in join operations
Example of an optimized plan
Here is an example of how an explain plan can be improved by SQL Query Analysis Agent.
The original explain plan shows:
-
RETURN (Cost: 125,000 timerons)
-
SORT (Cost: 115,000 timerons)
-
TBSCAN TABLE: ORDERS (Estimated Rows: 50,000)
The optimized explain plan shows:
-
RETURN (Cost: 45,000 timerons)
-
FETCH TABLE: ORDERS
-
IXSCAN INDEX: ORDERS_DATE_IDX (Estimated Rows: 500)
In this example, the optimized query uses an index (ORDERS_DATE_IDX) to scan only 500 relevant rows instead of reading all 50,000 rows from the table. This eliminates the expensive SORT operation and reduces the cost by 64%.
Evaluate optimization recommendations
Here is a decision guide based on the performance gain and the severity of the analysis results:
| Performance Gain | Severity | Action |
|---|---|---|
>25% improvement |
Any |
Strongly recommended to apply |
10-25% improvement |
Critical/Extreme |
Recommended to apply |
5-10% improvement |
Significant |
Consider applying for frequent queries |
<5% improvement |
Any |
Optional, may not be worth the effort |
Neutral (±2%) |
Any |
No benefit, keep original |
Negative |
Any |
Do not apply, keep original |
As an example, you would want to apply the optimized SQL if the AI Review Analysis showed these values:
-
Original CPU Cost: 125,000 timerons
-
Optimized CPU Cost: 45,000 timerons
-
Original Exec Time: .35 seconds
-
Optimized Exec Time: 0.89 seconds
In this example, the optimized query uses 64% fewer resources and runs 62% faster. This is a significant improvement that is worth applying.
Potential issues
This table shows issues or error messages you may encounter while using SQL Query Analysis Agent and how to resolve them:
| Issue or error message | Cause | Solution |
|---|---|---|
The Optimize option does not show. |
The AI app configs have not been set up. |
Contact Support to get the information required to set up the app configs. |
"SQL AI Analysis Failed — Network timeout" |
The system cannot reach the AI service endpoint. |
|
"Query CPU Cost Warning" opens before analysis. |
Your query’s CPU cost exceeds the threshold set by the Query Cost Threshold config. |
This is not an error. It is an informational warning. The severity level helps prioritize optimization efforts. Select OK to continue with AI analysis. Critical and Extreme queries should be optimized before production deployment |
"Explain plan error — continuing with AI analysis without explain plan data" |
The explain plan step failed. This could be due to SQL syntax or permissions. The AI can still provide recommendations, but you will not see CPU cost comparisons. |
|
Analysis shows negative performance change. |
The AI-optimized query is slower than your original. This may be because:
|
Do not apply the optimization. Keep your original SQL. |
Analysis show neutral performance change. |
The optimization provides minimal or no improvement. This happens when your query is already reasonably optimized. |
Keep your original SQL. No changes are needed. |
"Could not analyze optimized SQL performance" |
The optimized SQL has syntax errors or could not be tested. The AI can still provide recommendations, but there will be no execution time comparison for the optimized version. |
Review the optimized SQL carefully for syntax issues before applying. |