Dispatch Dashboard overview
Forecasting product demand and scheduling deliveries to retail service stations is no longer a planning-a-day-in-advance model. Higher volumes, frequent changes to retail pricing, and tighter product allocation management by suppliers demand a model that is more agile.
Agility relies on increased visibility and frequent reporting of information, including:
-
Inventory levels from automatic tank gauge systems
-
Actual delivered volumes
-
Wholesale pricing
Armed with this information, you can rearrange delivery schedules as market conditions change, and do it in real time.
The Dispatch Dashboard shows which stores are most in need of deliveries in real time. A graphical display shows each store’s sales, reading levels, and time to retain/runout. You can focus on the stores in critical need instead of reviewing each store individually.
Go to Application > Dispatch Dashboard.
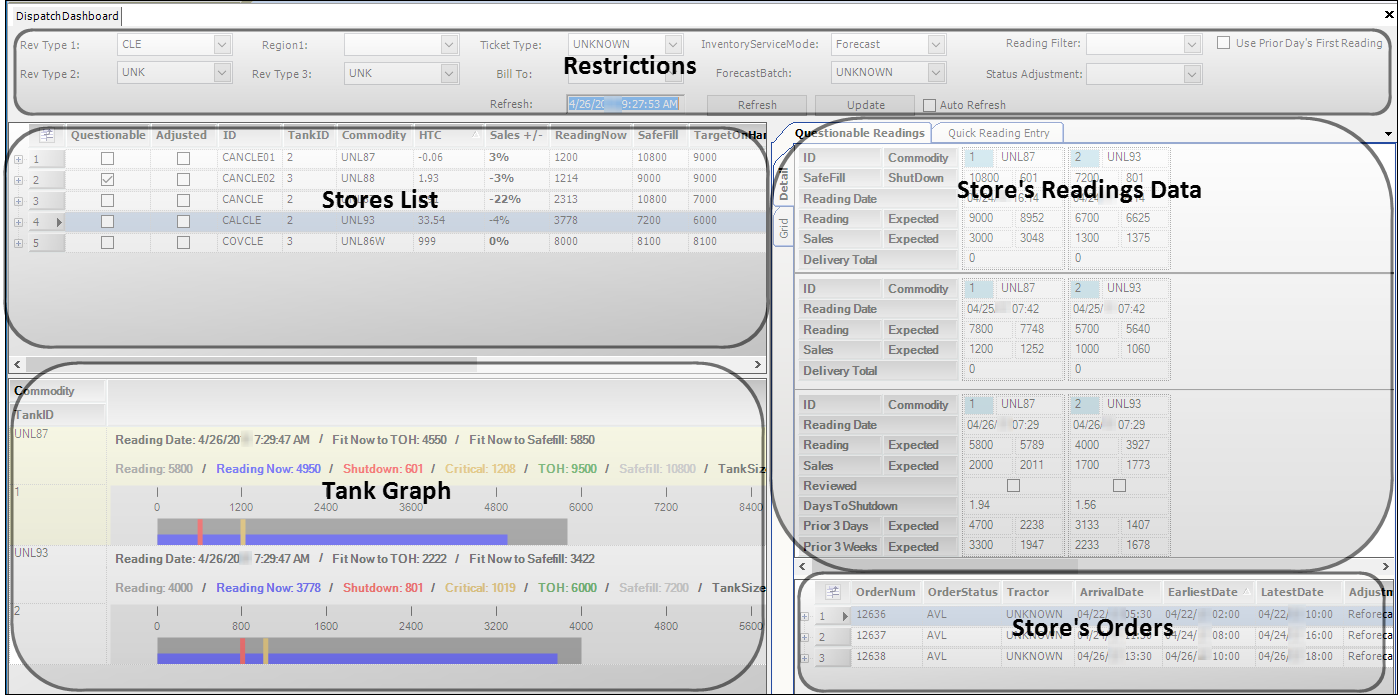
The window contains five sections.
| Section | Description |
|---|---|
Restrictions |
Use fields in this section to limit the retrieved stores. You can also:
The Refresh field shows the date/time you retrieved stores. If your system is set up to refresh data automatically, it shows the date/time the refresh took place. |
Stores List |
Stores matching the filters you set in the Restrictions section appear in the grid. |
Tank Graph |
This section provides a picture of current tank levels. It allows you to see at a glance a store’s tank levels, including how much product will fit in a tank without violating its Target on Hand setting. Information is pulled from the tank’s profile and its commodity forecast profile. Tanks are shown in the same order in which they appear in the Company Tank Setup window. Note: The Company Tank Setup window is accessed in the Inventory Services application. For details, see the Setting up the store’s tanks topic in the Inventory Services online help. |
Store’s Readings Data |
Three tabs are available in this section.
|
Store’s orders |
This section shows the orders for the selected store. It is visible only when the Questionable Readings/Detail tab is selected. Note: As of V.2017.50, this section provides on-demand forecasting functionality. For details, see On-Demand Forecasting. |