Profitability Reporting

Overview
Profitability Reporting is a collection of over 50 reports presenting profitability and costing information about your operations. Detailed, extremely accurate costing, allows for prorating of driver, equipment, and personnel costs. Revenues are also prorated based on the routes taken for delivery, other freight they may have been combined with, and other factors.
Those reports are designed to be extremely accurate. Although certain prorated calculations may cause revenues and costs to be less obvious, the end result is a 'true' reporting of what actually happened in operations. Your revenues and costs will be 'accrued' in each day correctly.
Leg Date or Bill Date Different Styles
That being said, different versions of reports are available. The basic difference is BY LEG DATE, or BY BILLING DATE. Reports produced by Leg Date will reflect the costs of moving your driver and equipment down the road for the day, and calculate the proportionate amount of the revenue for this same movement. This keeps all costs and revenues in the correct day, and best shows your profitability. The second option is BY BILL DATE. This option is useful when comparing the RP3 revenue numbers with your general ledger. A good example of this would come when a load is picked up August 30th, brought 400 miles to a yard, then delivered 10 miles away on September 1. The costs were mainly generated in August, yet since the revenue was actually billed in September, the G/L would show ALL the revenue in September. This report matches the g/l total posting, yet would show 400 / (400+10) of the costs in August. Not the most accurate costing, yet confirms all the revenues were properly shown. The BY LEG DATE options would have shown 400 / (400+10) of the costs in August, as well as the same percentage of the revenues in August. The remainder of the costs and revenues (10 / (400 + 10) would follow in September
Setup Considerations
The Importance of Mileage
Nearly every cost calculation in RP3 is based on the LEG MILES. Prorated values determine the percentage of the total miles taken to deliver the freight this leg comprises… then prorates the revenue and costs proportionately. If you have legs WITHOUT mileages, these reports will be inaccurate. Time should be taken to assure all zones utilized in dispatch are valid, and as a result, generate mileages in all legs created.
Application Configuration Options
There are four options in the APPLICATION CONFIGURATOR which you should set to your own company’s requirements. These settings are used for 'estimations' of costing information, specifically fuel consumption and dispatcher office costs. You will see these options in the program "TruckMate > Utilities > Application Configurator"… under the program COSTING.EXE. The options are:
Fleet Average MPG
This option, combined with the Average Fuel Price Per Gallon, will be used to estimate the fuel consumed on a leg of a trip. Dispatch (and Mileserver) will have looked up the miles on a leg of a trip, then with the calculation of "Miles traveled / Fleet average mpg) will give us the gallons of fuel consumed, with this number then multiplied by the Average Fuel Price Per Gallon below. This will be the Fuel Costs for the leg of the trip. If you are reporting miles from MILESERVER as MILES, then make sure you enter the fuel price and average mpg is miles and gallons. If you have decided to change the default PCMiler settings and report back Kilometers, then you should enter the Fleet average kilometers per liter and Average fuel price as per liter. You should be able to verify 'reasonableness' of these settings by evaluating the calculated fuel cost from RP3 for one leg of a trip against a manual calculation. Default on setup: 8.00 mpg
Dispatch Cost (per freight bill)
Used by some companies to estimate the 'administrative cost' of performing a dispatch. This figure is up to your own organizations requirements, and can be left at zero to skip. For true costing, it is recommended you estimate the cost of a dispatcher for a month, including phone, salary, and optionally office costs. Divide this monthly cost by an estimate of the 'freight bills' a dispatcher would be involved in dispatching during the month. This is the figure you would enter here. An example could be: My typical dispatcher’s monthly costs of $3,000 payroll, $500 phone costs, $900 office overhead, totaling $4,400 per month. A typical dispatcher manages a fleet size of 50 drivers, each doing 2 loads (freight bills) per day, working an average 22 working days per month. The DISPATCH COST per freight bill would therefore be ($3,000 + $500 + $900) / (50 * 2 * 22), or $4,400 / 220 bills, or $20 per freight bill. Default on setup: $10.00
Empties go to
This option is designed to give you the ability to have the EMPTY LEGS charged against the NEXT LOADED LEG, or the PREVIOUS EMPTY LEG. The settings for this are "LAST TRIP" or "NEXT TRIP". If you use the LAST TRIP setting, then the empty mileages are assumed the responsibility of the trip that took you there, i.e. if the trip paid well and was to Alaska, the cost of getting to the next trip should be charged back to the previous shipment. The reverse logic applies for NEXT TRIP. Default on setup: LAST TRIP
Changing These Values Later
NO historical records are kept of these values. As a result, if you change the values and recalculate the costs using the CALCULATE REVENUE AND COSTS.rpt, then the costs will reflect the latest setting. If you do want to increase the values without affecting the previously calculated values, you must do this manually by NOT causing a recalculation using the new rates on old trips. If you think this may have happened, simply reset the values, recalculate only the old trips, and then reset the values to the new settings.
Profile Setups for Power Units and Trailers
Two additional areas should be set up for COMPANY equipment. These fields are identical in both the POWER UNIT PROFILES and TRAILER PROFILES. The fields can be found on the CHARGES TAB, and are labeled RATE/MILE and FLAT CHARGES. You would use the fields for:
Rate/Mile
Enter the cost per running mile this piece of equipment costs your company. RP3 does not factor in repair and maintenance costs for tires, engines, deck replacements, etc, so this is your opportunity to record your fleet estimates. These are generally variable costs, suggesting that if the trailer did not move, then these costs would not be incurred. Generally, if the piece of equipment is an owner operator’s, then the cost should be left at zero. Default on setup: 0.00
Flat Charges
Think of this as the cost of having a piece of equipment sitting idle all month. These are the fixed costs, the monthly depreciation and the lease costs. If you did not use the equipment, you would still incur these costs. Take the total costs for the month and divide by 30 to get a daily cost. Enter this value. Default on setup: 0.00
How to run the reports
The reports are relatively straightforward. The access a table calling COSTING_DATA and sort and group the results for reporting. Very limited calculations are done at the reporting stage.
The calculations and smarts of RP3, are contained in a routine executed when you run the CALCULATE REVENUE AND COSTS.rpt. This Crystal Report provides little in the way of valuable printed data, yet it performs the calculations required for all the other 50+ reports. If this routine is not completed successfully, reports will not be correct.
You can run this report direct through the Crystal Report Launcher. After requesting this report, you will have the options for a SPECIFIC RANGE OF TRIPS, and a SPECIFIC RANGE OF DATES. In most cases, you will be running this report by date, so set the trip range to be Starting: 0, and Ending: 9999999. This will include all trips. The Range of Dates refers to the LEG DATE. Select a wider than required range of dates for this selection, i.e. if you are running the report for August 15th to August 31st, then make the dates August 1st to August 31st. The reasons are 1) It doesn’t hurt to redo calculations for prior periods as the calculations are quite quick, and 2) Billing information may have been changed since you last calculated the Aug 1st to Aug 14th period, so this will pick up the changes and recalculate the values.
Another option is the User Exchange rate which allows you to convert to your base currency and see the actual converted amount at the rate you insert. It will look at all the bills and use the number you provide to convert the number back to your base. If you have loads going into the US, it will convert the US amount to CDN dollars at the exchange rate that was input as a parameter.
Once the report has completed its calculations, two pages will be returned. Many of the reports are explained for your reference on these pages, informing you as to how the calculations have been performed. This information can be tossed out and is NOT required as a system audit.
Time to Execute the Calculation Routine
The CALCULATION REPORT could take anywhere from 30 seconds to 60 minutes, primarily based on the number of freight bills, the number of trip legs, and the number of days you have selected for calculations. Most companies complete this calculation in less than 10 minutes.
Calculate Revenue and Costs
| This report must be run before you can successfully use the other reports provided with Report Pack 3. |
When you open this report, it will ask for several criteria:
-
A 'Start Date' for the Date Range that will be used to gather Trip Data.
-
An 'End Date' for the Date Range that will be used to gather Trip Data. This Range can be set for any length of time you require, but you should run this report often, whenever significant changes occur to the data in your system.
-
An 'Exchange Rate' value: most Users will leave this value at it’s default of '1', but you may change this value to convert the values found in your system using the rate entered here. For example: if you enter the value '2' in this field, all of the Freight Bill totals found within the Date Range you have provided will be multiplied by a factor of '2'.
-
A value representing the 'Start Trip': you may leave this at it’s default to include all trips, or enter a value here to exclude Trips below that value.
-
A value representing the 'End Trip' of the Trip Range: you may leave this value at '999,999,999', or enter a value here to exclude Trips that come after that value.
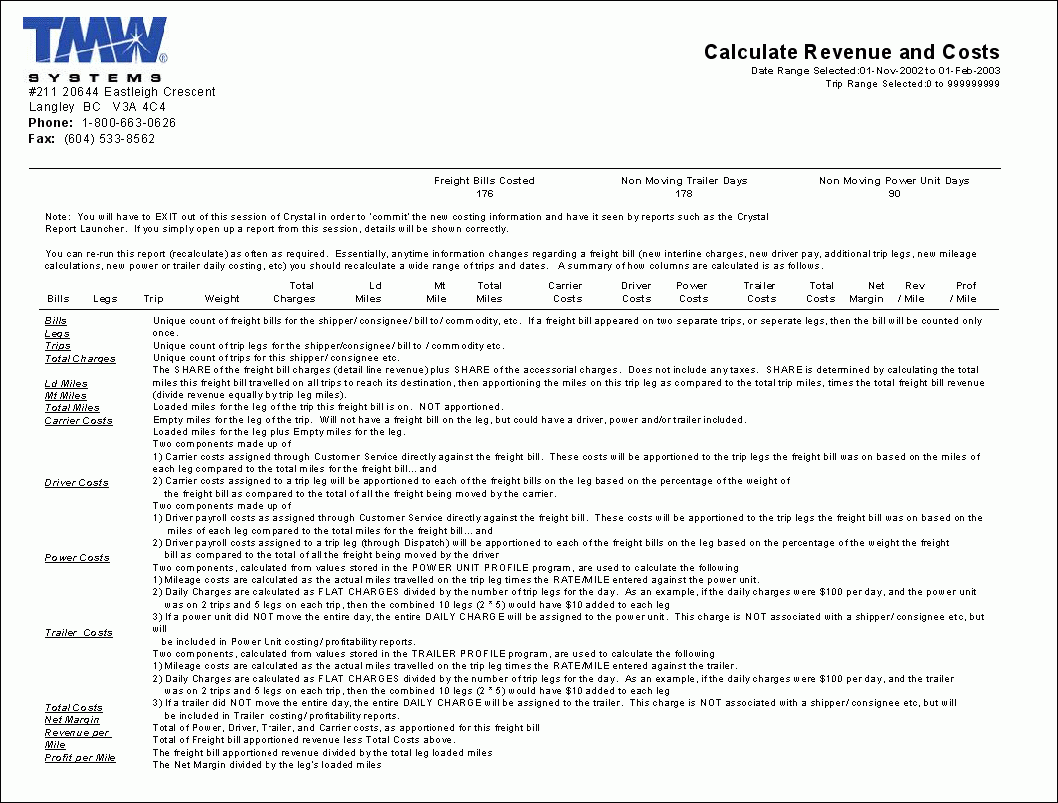
The Report will run and produce three pages of data that explain the various fields and Reports you will find in Report Pak 3, and will provide a breakdown of the data that has been calculated for the purpose of the Report Pak 3 reports. Click below for an image detailing the first page of the Report.
Looking inside the calculations
The Calculate Revenue and Costs.rpt runs a procedure that performs the calculations and populates the COSTING_DATA table. The specific details of the calculations are detailed below.
Clients with No Activity Report
This special report is calculated differently.The report is designed to identify customers who have PREVIOUSLY been active with your company, that have recently become inactive.The report is designed to easily identify customers that may be taking their business else where because of rates, customer service issues, or a decrease in volume.If in the case of customer service issues or rates, you have the opportunity to respond quickly and regain their confidence.If volumes are decreasing, the shipper may be entering a dangerous future cash shortage to which you should preemptively alert your A/R collections department for aggressive attention.
The report can be run for one of the following categories: 'CALLER', 'SHIPPER', 'CONSIGNEE', or 'BILLTO'.Once determined, you will have options to enter values for 'NO ACTIVITY IN LAST' as well as 'YET ACTIVE WITHIN'.The answers you enter for these will be determined by how frequently your customers usually ship with you.Truckload may have a wider range as less activity per customer would occur, whereas a LTL trucking company may look back one week only.Example of this could be: Only include 'BILLTOs' which have shipped with me over the last 30 days ('YET ACTIVE WITHIN'), which have not shipped with me in the last 10 days ('NOT ACTIVITY IN LAST').The report would then gather a list of customers that you have worked with over the last 30 days yet have been suspiciously quiet in the last 10 days.TruckLoad operators may expand this out to show clients that have shipped with you in the last 60 days who have not shipped with you in the past 30 days.
The report will contain information required to make proactive calls to the 'suspiciously quiet' customers.Specifically you will see their name, contact, phone and fax numbers, open and close times, customer since, A/R balance owing, and recent bill count volume.
| This report has been reported as being EXTREMELY COMPUTER INTENSIVE… in its earlier versions.If you suspect the report takes an inordinate amount of time to run, and/or the report appears to affect other users response times, please contact TMW Systems Support team for an updated report.This report should execute rather effortlessly in about a minute or less. |
Freight Bill Costing Procedure
The procedure executed as part of the 'CALCULATE REVENUE AND COSTS.rpt' performs the following functions:
Initialization
In this step, all previously calculated revenue and costs for the trip and date range provided will be deleted.This is in preparation for the next phase that will replace the values with the most current calculations.
Legs Selected for Processing
If a trip leg falls within the trip number range entered, AND, either the leg actual date of completion or the expected date of completion falls within the date range entered, the leg is selected for processing.
Actual Leg Dates vs. Expected Leg Dates
If a trip is still unfinished, the ACTUAL LEG COMPLETION date may not be available and still be recorded as 1-1-1980. In these cases, the EXPECTED LEG COMPLETION will be used.
Once a leg is selected, the first step is to determine which freight bills were on the leg.
Each freight bill identified then performs a calculation to determine ALL the miles required on ALL trips… to complete the delivery of the freight. The number of leg segments required to complete the delivery is also counted.
Other equipment used on the leg is recorded against this record, as well as the leg loaded or leg empty mileage.
Weights and Prorating
Since multiple freight bills may be on the leg, the calculated cost of the equipment will be prorated against each invoice according to the freight bill’s proportionate share of the total weight. In the case where a freight bill has not had weight against it, a standard 100 pounds will be used. If the weight was simply missed, later auditing of the freight bill will correct this to actual, subject to you rerunning the calculations routine again. If your company does not use weight in Customer Service, then each bill will have 100 pounds associated with it and as a result, will equally share in the costs.
Fuel Costs
Fuel costs are simple calculations of distance traveled times miles per gallon times cost per gallon (as set up in the APP CONFIGURATOR discussed previously).
Fuel consumed is set to ZERO if the OWNERSHIP TYPE, as set in the Power Unit Profile, is NOT 'C' (Company), 'R' (Rental) or 'L' (Lease).
Dispatch Costs
We then calculate the percentage of miles this LEG represents of the total TRIP. The DISPATCH COSTS are then charged against this leg. An example of this may be if the dispatch cost per freight bill is $10, and this leg of the trip represents 20% of the trip miles, and the freight bill was on 4 trips in total to get to completion, then the dispatch costs for this leg would be $10 / 4 trips, or $2.50 per trip, and since this leg is 20% of the trip, the 50 cents would be charged against this leg.
Dispatch Costs are applied to parent bills only, and will not be charged against the extra stop bills (bill numbers containing a '-').
Credit Memos and Re-bills
When calculating the revenues from a freight bill, credit memos and re-bills are included in the totals. This assures totals of revenues are not skewed based on post invoicing corrections. You should consider recalculating older periods with these adjustments periodically.
Currency Exchange Rates
Information for revenues on extra-stop bills is taken from the parent bill only. RP3 takes the totals of freight bill charges, extra charges, outside carrier costs, and currency converted bill totals. RP3 will prompt the user for a foreign exchange value. If this value is provided, and RP3 recognizes a freight bill as previously currently converted, the old conversion will be undone, and the new currency rate provided will be used instead. If the rate is not entered at the start of the RP3 costing, the original currency exchange rate used, if applicable, will be retained.
Outside Carrier Costing
Outside Carriers costs can be entered into TruckMate in two separate areas. First, if the dispatch enters a freight charge against a trip, the proportionate amount of the charge, based on weight, will be attributed to each freight bill on the leg. Additionally, Interliner charges may have been entered directly against a freight bill in CSERV. In this case, the amount of miles this leg represented of the total miles the freight bill traveled on all trips, would represent the percentage of the charge applied to this leg. Finally, initial cost allocations are based on the amount setup by the dispatcher, yet if changed in the later Interliner Charges Audit to a different number; this audited number will be used instead.
Driver Payables Costing
Driver Payables are much the same as outside carriers above. If the driver is paid on mileage, i.e. on a leg-by-leg basis, then the costs of the driver wages are
prorated by the weight of the freight bills on the leg. If the driver is paid on a freight bill basis, then the percentage this leg traveled represents of the total miles for this bill, would determine the percentage of the driver costs applied to this leg. If auditing of the driver pay records changes the amount expensed, the newly audited number will replace the previous estimate.
Power Unit Costing
Power unit DAILY COSTS are calculated by taking the DAILY COSTS figure from the Power Unit Profile, then dividing the leg miles into the total of the miles traveled by the power unit in the same day. A separate routine is run at the end of this procedure to identify days that the routine did not charge a daily rate on. Separate records for reporting are then created to record each daily cost not previously calculated.
A per mile charge is calculated for each leg of the trip by calculating the mileage traveled times the mileage rate in the power unit profile. If multiple freight bills were on this leg, the proportionate amount is charged based on the percentage of the total weight each freight bill represented.
Trailer Costing
Trailer costs are calculated the same as the Power Unit detailed above, other than for obvious reasons, the fuel calculations are not included.
Textual Fields Added to Record
Each costing record is recorded with additional reporting information, including
-
TRIP FROM ZONE: represented as the start zone of the FIRST LOADED LEG of the trip
-
TRIP TO ZONE: represented as the end zone of the LAST LOADED LEG of the trip
-
TRIP FROM STATE: Takes the selected TRIP FROM ZONE above, and using the ZONE TREE, searches through the tree until a valid 2 letter state abbreviation code is found (i.e. BC, NY, CA, ON, TX, etc)
-
TRIP TO STATE: As above, except performed against the TRIP TO ZONE
-
LEG FROM STATE: As above, except performed against the LEG FROM ZONE
-
LEG TO STATE: As above, except performed against the LEG TO ZONE
Empty Legs
Early versions of RP3 automatically associated empty legs with the previously loaded legs. In newer versions, an option has been added in APP CONFIGURATOR to associate empties with the NEXT LOADED leg. The options for this are shown in the APP CONFIGURATOR section detailed at the start of this document.
Multiple Records for Each Freight Bill
If you were to look in the COSTING_DATA table after running this routine, you may see MANY separate records for the same freight bill. Separate records are created for each freight bill, for each leg, for each trailer. Therefore is a freight bill was on three legs on a trip, with 2 trailers attached to each leg, then you would see the revenues and costs separated into 6 separate records. This is done to allow profitability by trailer; assuring revenues are split between trailers and not duplicated.
Non-Active Equipment
Once the costing routine is completed, a second scan is performed to assure 'daily costs' have been charged for each piece of equipment… for each day of the period specified. This includes weekends. If a daily cost is missing, an additional costing record will be created for each day missing. No consignee, shipper, zone, or other textual information will be attached to this record, therefore these costs will ONLY show on the Power Unit and Trailer Profitability reports.
State-to-State Statistics Report
This report is valuable to see volume trends IN TO and OUT OF specific states and provinces. The routine utilizes the values calculated in the COSTING_DATA table (discussed above), and produces statistics between states. For any state-to-state combination having at least one load in the period specified, you will be presented with
-
Number of TRIPS.
-
Total Charges (currency converted) for the LEG (includes Extra Charges).
-
Total Miles (includes both loaded and empty miles).
The report will be divided into four intervals, so if you enter an interval level of 7 (i.e. a week), you will see statistics for the last 4 weeks. If you enter 30, you would see the report summarized for the last 4 months, etc.
Information is first accessed as a head-haul then reversed to see the back haul activity. Both values are combined on the same line on the report, clearly identifying trends in traffic lane profitability.
Profitability Reports
The Profitability' Reports are ideal for determining the revenue, costs, or profitability of your freight bills as well as the profitability associated to your assets. Traditionally determining a trip’s profitability is determined on a trip by trip basis not taking into account such items as trailer demurrage, power unit down days, back filled freight, late adjusted carrier changes, and other costs. Report Pack 3 addresses these problems by combining aspects of different reports allowing you to better determine the profitability of your operations. To attain useful estimates of profitability it is imperative you have accurate mileages on each leg of the trip. Using Maddocks 'MILESERVER' and recording good leg points will ensure costing is correct each time you need a report.
| Although many profitability reports are available, each specialized in one aspect of profitability (as described next), there is also one comprehensive report (Profitability), that can provide all the information reported by all the specialized reports put together, it can be used in place of all other profitability reports. |
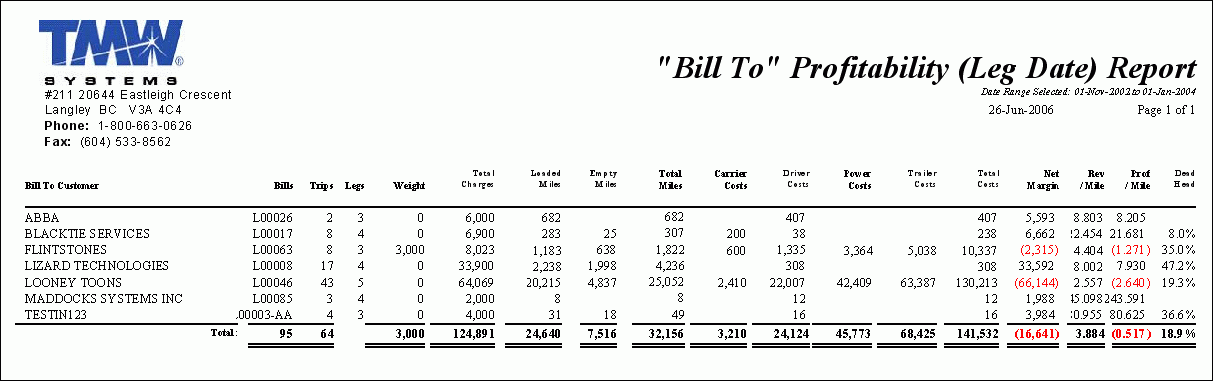
Bill To Profitability
The 'Bill To Profitability' report, when run, will ask for either a 'Summary' or 'Detail' report level, and a 'Starting' and 'Ending' Date that will determine the report’s Date Range.
-
The Summary report lists the 'Bill To Customer', 'Bills', 'Trips', Trip 'Legs', and 'Weight' information, followed by a host of different 'Cost' values (Power Unit, Trailer, etc.). A 'Total' of costs is given, as well as a 'Net Margin' value, 'Revenue/mile' and 'Profitability/Mile' and 'Dead Head' values. The records are ordered by their 'Leg Date'.
-
The Detailed report lists all of the information found in the 'Summary' report, as well as breakdown of the individual 'Trip' information from the Freight Bill.
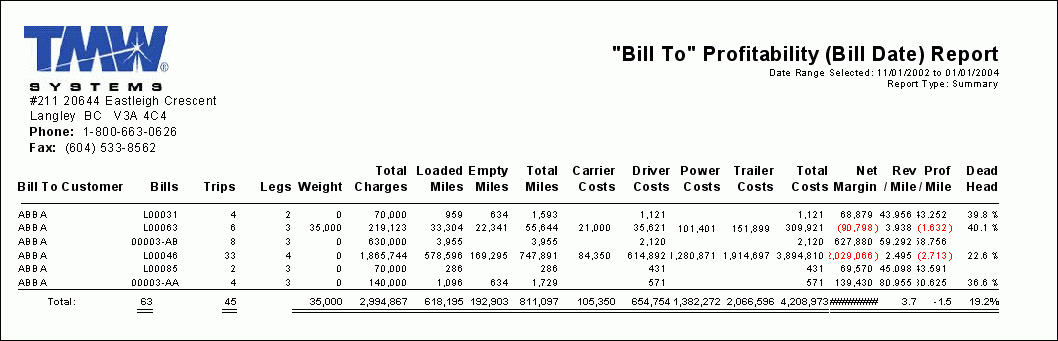
Bill To Profitability by Bill Date
The 'Bill To Profitability by Bill Date' report, when run, will ask for either a 'Summary' or 'Detail' report level, and a 'Starting' and 'Ending' Date that will determine the report’s Date Range.
-
The Summary report lists the 'Bill To Customer', 'Bills', 'Trips', Trip 'Legs', and 'Weight' information, followed by a host of different 'Cost' values (Power Unit, Trailer, etc.). A 'Total' of costs is given, as well as a 'Net Margin' value, 'Revenue/mile' and 'Profitability/Mile' and 'Dead Head' values. The records are ordered by their 'Bill Date'.
-
The Detailed report lists all of the information found in the 'Summary' report, as well as breakdown of the individual 'Trip' information from the Freight Bill.
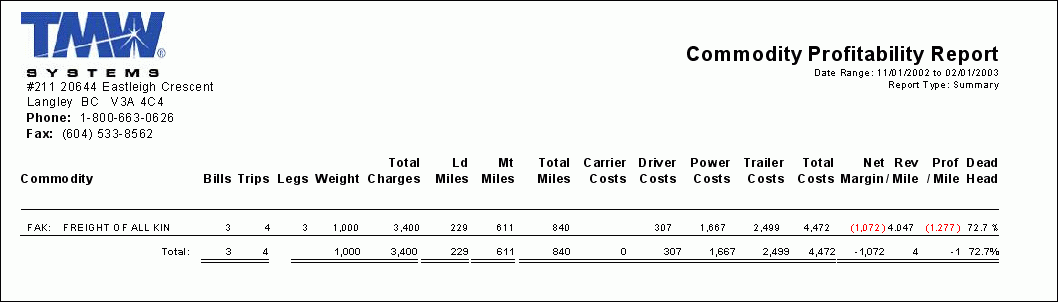
Commodity Profitability
The 'Commodity Profitability' report, when run, will ask for either a 'Summary' or 'Detail' report level, and a 'Starting' and 'Ending' Date that will determine the report’s Date Range.
-
The Summary Report lists the 'Commodity', 'Bills', 'Trips', Trip 'Legs', and 'Weight' information, followed by a host of different 'Cost' values (Power Unit, Driver, Trailer, etc.). A 'Total' of costs is given, as well as a 'Net Margin' value, 'Revenue/mile' and 'Profitability/Mile' and 'Dead Head' values. The records are ordered by their 'Leg Date'.
-
The Detailed report lists all of the information found in the 'Summary' report, as well as breakdown of the individual 'Trip' information from the Freight Bills.
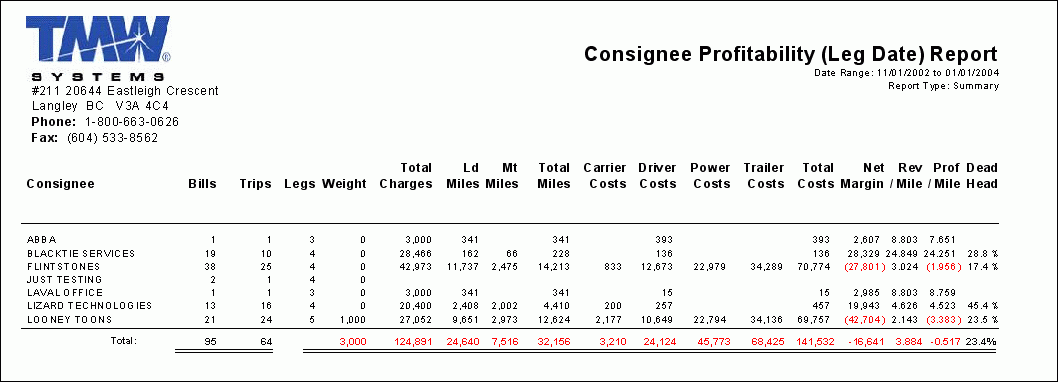
Consignee Profitability
The 'Consignee Profitability' report, when run, will ask for either a 'Summary' or 'Detail' report level, and a 'Starting' and 'Ending' Date that will determine the report’s Date Range.
-
The Summary Report lists the 'Consignee', 'Bills', 'Trips', Trip 'Legs', and 'Weight' information, followed by a host of different 'Cost' values (Power Unit, Driver, Trailer, etc.). A 'Total' of costs is given, as well as a 'Net Margin' value, 'Revenue/mile' and 'Profitability/Mile' and 'Dead Head' values. The records are ordered by their 'Leg Date'.
-
The Detailed report lists all of the information found in the 'Summary' report, as well as breakdown of the individual 'Trip' information from the Freight Bills.
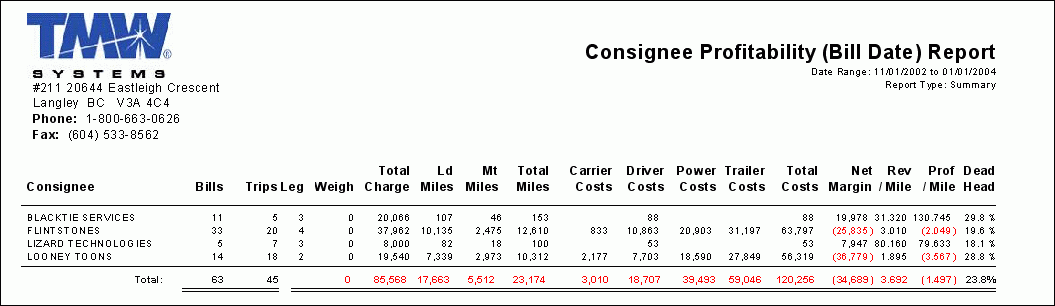
Consignee Profitability by Bill Date
The 'Consignee Profitability by Bill Date' report, when run, will ask for either a 'Summary' or 'Detail' report level, and a 'Starting' and 'Ending' Date that will determine the report’s Date Range.
-
The Summary Report lists the 'Consignee', 'Bills', 'Trips', Trip 'Legs', and 'Weight' information, followed by a host of different 'Cost' values (Power Unit, Driver, Trailer, etc.). A 'Total' of costs is given, as well as a 'Net Margin' value, 'Revenue/mile' and 'Profitability/Mile' and 'Dead Head' values. The records are ordered by their 'Bill Date'.
-
The Detailed report lists all of the information found in the 'Summary' report, as well as breakdown of the individual 'Trip' information from the Freight Bills.
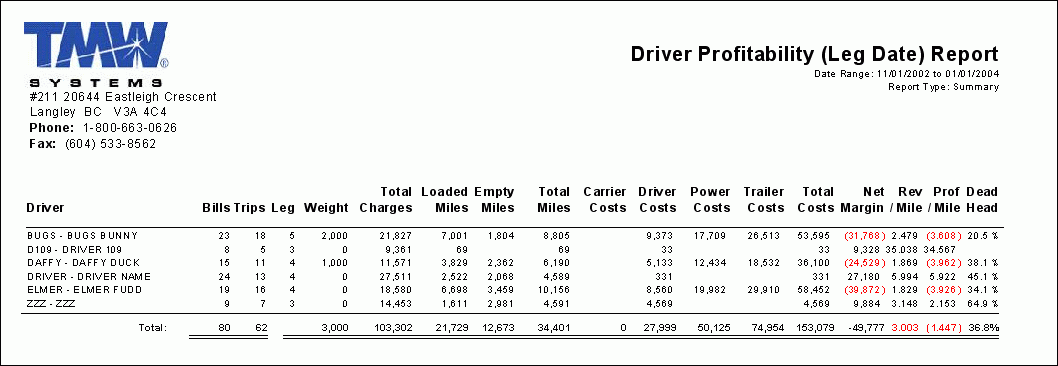
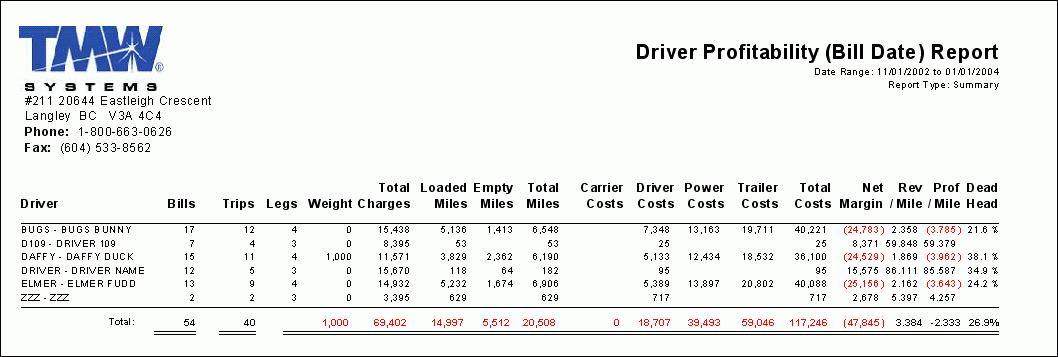
Driver Profitability
The 'Driver Profitability' report, when run, will ask for either a 'Summary' or 'Detail' report level, and a 'Starting' and 'Ending' Date that will determine the report’s Date Range.
-
The Summary Report lists the 'Driver', 'Bills', 'Trips', Trip 'Legs', and 'Weight' information, followed by a host of different 'Cost' values (Power Unit, Driver, Trailer, etc.). A 'Total' of costs is given, as well as a 'Net Margin' value, 'Revenue/mile' and 'Profitability/Mile' and 'Dead Head' values. The records are ordered by their 'Leg Date'.
-
The Detailed report lists all of the information found in the 'Summary' report, as well as breakdown of the individual 'Trip' information from the Freight Bills.
Driver Profitability By Bill Date
The 'Driver Profitability by Bill Date' report, when run, will ask for either a 'Summary' or 'Detail' report level, and a 'Starting' and 'Ending' Date that will determine the report’s Date Range.
-
The Summary Report lists the 'Driver', 'Bills', 'Trips', Trip 'Legs', and 'Weight' information, followed by a host of different 'Cost' values (Power Unit, Driver, Trailer, etc.). A 'Total' of costs is given, as well as a 'Net Margin' value, 'Revenue/mile' and 'Profitability/Mile' and 'Dead Head' values. The records are ordered by their 'Bill Date'.
-
The Detailed report lists all of the information found in the 'Summary' report, as well as breakdown of the individual 'Trip' information from the Freight Bills.
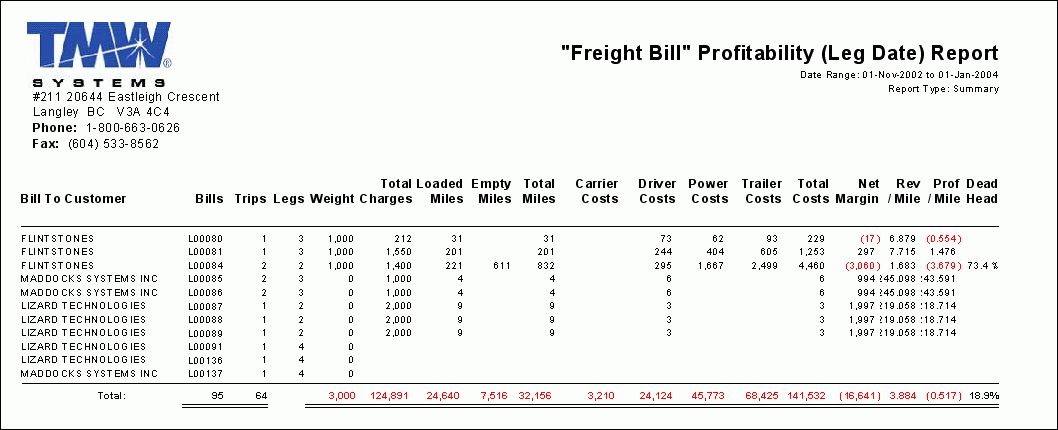
Freight Bill Profitability
The 'Freight Bill Profitability' report, when run, will ask for either a 'Summary' or 'Detail' report level, and a 'Starting' and 'Ending' Date that will determine the report’s Date Range.
-
The Summary Report lists the 'Bill To Customer', 'Bills', 'Trips', Trip 'Legs', and 'Weight' information, followed by a host of different 'Cost' values (Power Unit, Driver, Trailer, etc.). A 'Total' of costs is given, as well as a 'Net Margin' value, 'Revenue/mile' and 'Profitability/Mile' and 'Dead Head' values. The records are ordered by their 'Leg Date', and a 'Total' is summarized for each of the columns at the end of the report.
-
The Detailed report lists all of the information found in the 'Summary' report, as well as breakdown of the individual 'Trip' information from the Freight Bills.
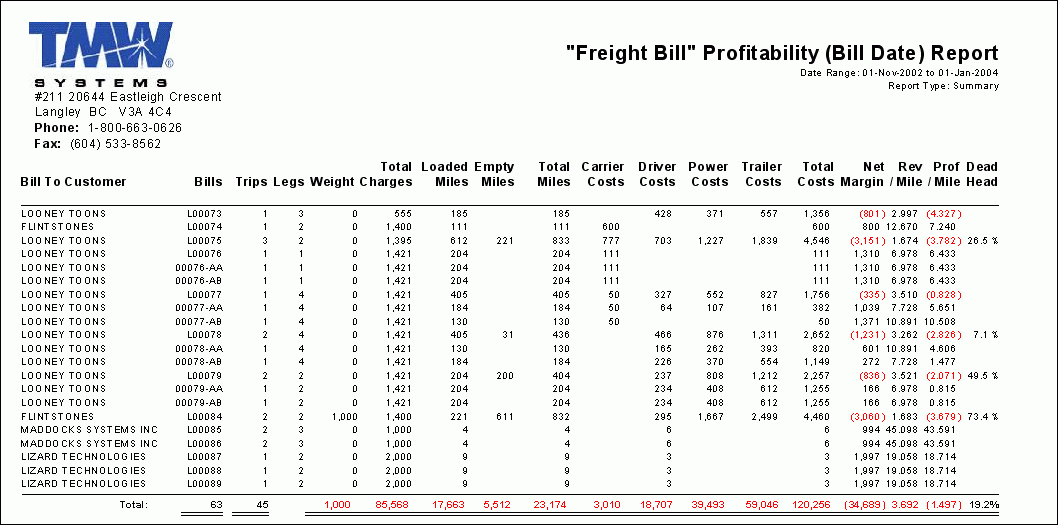
Freight Bill Profitability by Bill Date
The 'Freight Bill Profitability by Bill Date' report, when run, will ask for either a 'Summary' or 'Detail' report level, and a 'Starting' and 'Ending' Date that will determine the report’s Date Range.
-
The Summary Report lists the 'Bill To Customer', 'Bills', 'Trips', Trip 'Legs', and 'Weight' information, followed by a host of different 'Cost' values (Power Unit, Driver, Trailer, etc.). A 'Total' of costs is given, as well as a 'Net Margin' value, 'Revenue/mile' and 'Profitability/Mile' and 'Dead Head' values. The records are ordered by their 'Bill Date', and a 'Total' is summarized for each of the columns at the end of the report.
-
The Detailed report lists all of the information found in the 'Summary' report, as well as breakdown of the individual 'Trip' information from the Freight Bills.
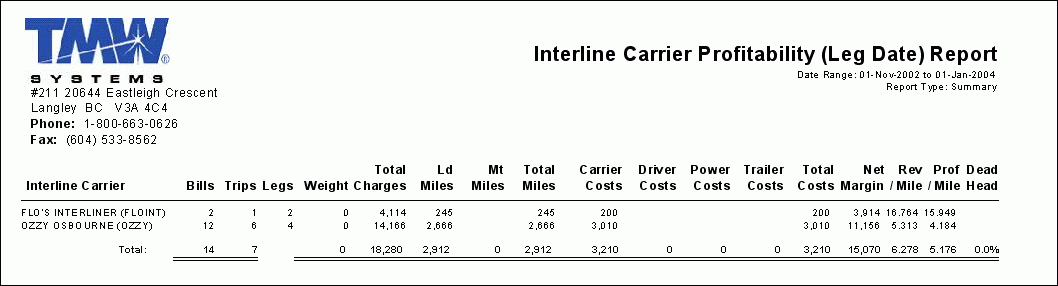
Interline Carrier Profitability
The 'Interline Carrier Profitability' report, when run, will ask for either a 'Summary' or 'Detail' report level, and a 'Starting' and 'Ending' Date that will determine the report’s Date Range.
-
The Summary Report lists the 'Interline Carrier', 'Bills', 'Trips', Trip 'Legs', and 'Weight' information, followed by a host of different 'Cost' values (Power Unit, Driver, Trailer, etc.). A 'Total' of costs is given, as well as a 'Net Margin' value, 'Revenue/mile' and 'Profitability/Mile' and 'Dead Head' values. The records are ordered by their 'Leg Date', and a 'Total' is summarized for each of the columns at the end of the report.
-
The Detailed report lists all of the information found in the 'Summary' report, as well as breakdown of the individual 'Trip' information from the Freight Bills.
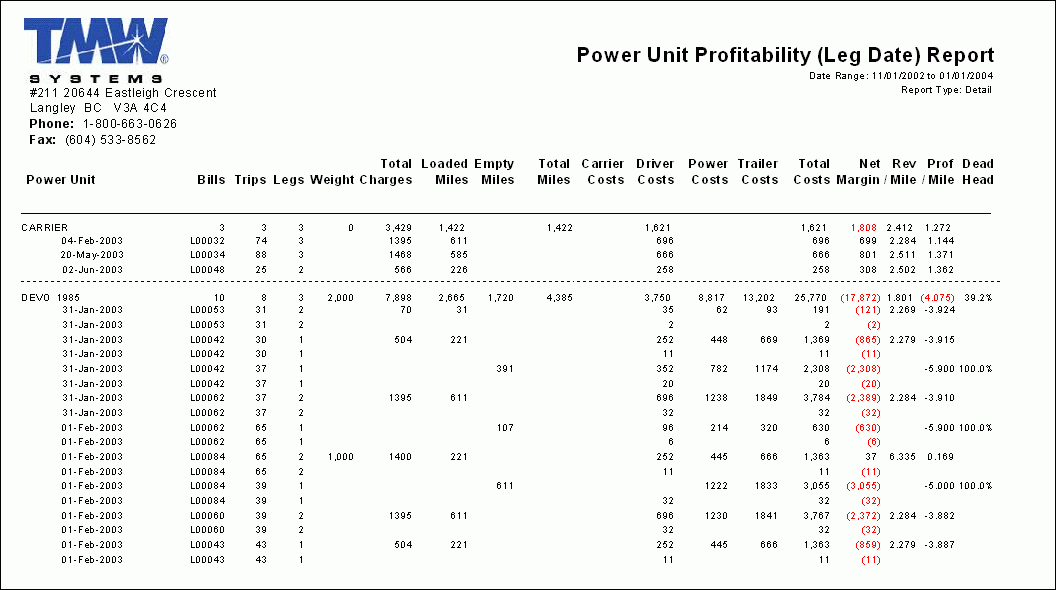
Power Unit Profitability
The 'Power Unit Profitability' report, when run, will ask for either a 'Summary' or 'Detail' report level, and a 'Starting' and 'Ending' Date that will determine the report’s Date Range.
-
The Summary Report lists the 'Power Unit', 'Bills', 'Trips', Trip 'Legs', and 'Weight' information, followed by a host of different 'Cost' values (Power Unit, Driver, Trailer, etc.). A 'Total' of costs is given, as well as a 'Net Margin' value, 'Revenue/mile' and 'Profitability/Mile' and 'Dead Head' values. The records are ordered by their 'Leg Date', and a 'Total' is summarized for each of the columns at the end of the report.
-
The Detailed report lists all of the information found in the 'Summary' report, as well as breakdown of the individual 'Trip' information from the Freight Bills.
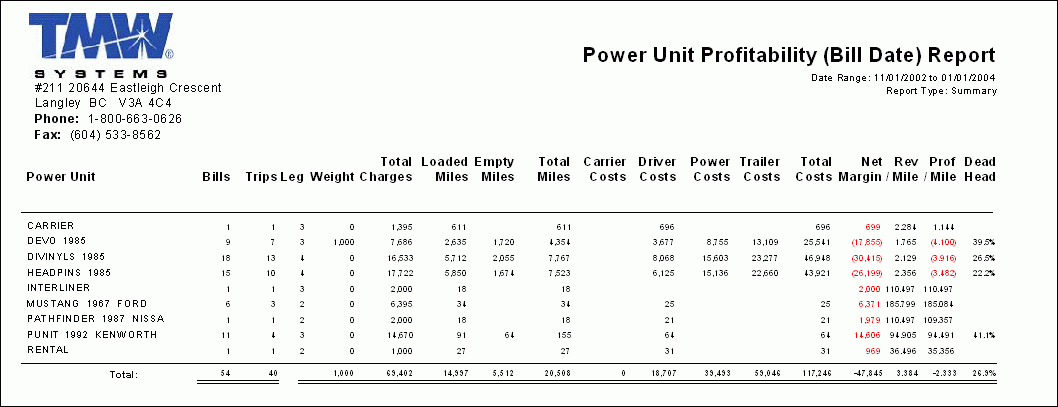
Power Unit Profitability by Bill Date
The 'Power Unit Profitability by Bill Date' report, when run, will ask for either a 'Summary' or 'Detail' report level, and a 'Starting' and 'Ending' Date that will determine the report’s Date Range.
-
The Summary Report lists the 'Power Unit', 'Bills', 'Trips', Trip 'Legs', and 'Weight' information, followed by a host of different 'Cost' values (Power Unit, Driver, Trailer, etc.). A 'Total' of costs is given, as well as a 'Net Margin' value, 'Revenue/mile' and 'Profitability/Mile' and 'Dead Head' values. The records are ordered by their 'Bill Date', and a 'Total' is summarized for each of the columns at the end of the report.
-
The Detailed report lists all of the information found in the 'Summary' report, as well as breakdown of the individual 'Trip' information from the Freight Bills.
Profitability
The 'Profitability' report is designed to replace all existing Profitability reports.
-
This report gives you the options to report by 'BILL TO', 'SHIPPER', 'CONSIGNEE', 'INTERLINER', 'DRIVER', 'POWER UNIT', 'TRAILER', 'TRIP', 'FREIGHT BILL' and 'COMMODITY'.
-
The 'Profitability' report, when run, will ask for either a 'Summary' or 'Detail' report level, a date type and a 'Starting' and 'Ending' Date that will determine the report’s Date Range.
-
The Summary report lists the 'Bills Counts', 'Trips', Trip 'Legs', and 'Weight' information, followed by a host of different 'Cost' values (Power Unit, Trailer, etc.). A 'Total' of costs is given, as well as a 'Net Margin' value, 'Revenue/mile' and 'Profitability/Mile' and 'Dead Head' values. The records are ordered by their 'Leg Date'.
-
The Detailed report lists all of the information found in the 'Summary' report, as well as breakdown of the individual 'Trip' information from the Freight Bill.
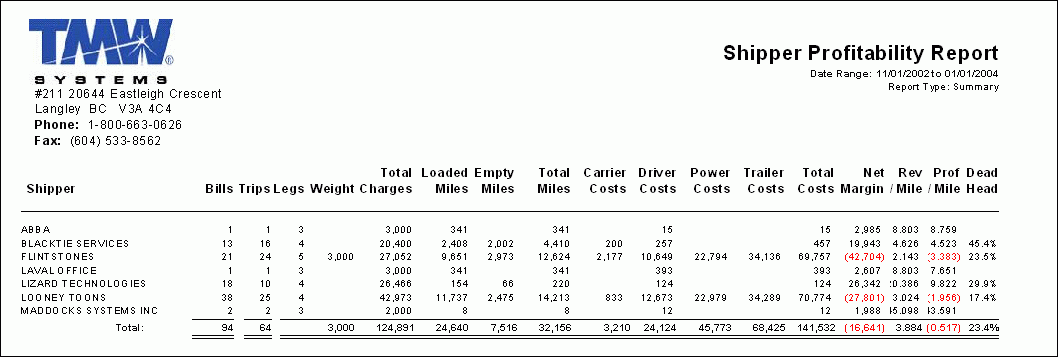
Shipper Profitability
The 'Shipper Profitability' report, when run, will prompt the User for either a 'Summary' or 'Detail' report, as well as a 'Starting' and 'Ending' Date that will comprise the Trip Date Range
-
The Summary Report lists the 'Shipper', 'Bills', 'Trips', Trip 'Legs', 'Weight' and 'Miles' information, followed by a host of different 'Cost' values (Power Unit, Driver, Trailer, etc.). A 'Total' of costs is given, as well as a 'Net Margin' value, 'Revenue/mile' and 'Profitability/Mile' and 'Dead Head' values.
-
The records are ordered by their 'Shipper', and a 'Total' is summarized for each of the columns at the end of the report.
-
The Detailed report lists all of the information found in the 'Summary' report, as well as breakdown of the individual 'Trip' information from the Freight Bills.
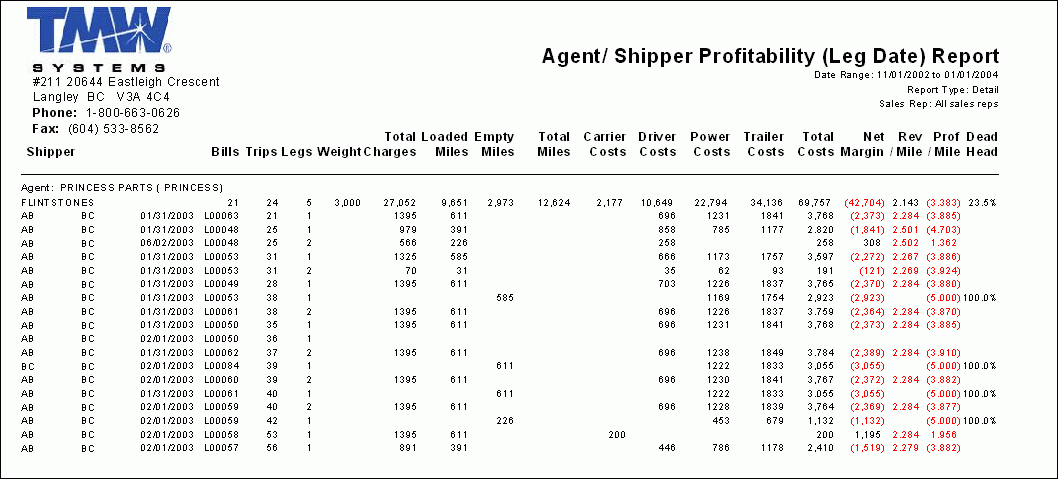
Shipper Profitability by Agent
The 'Shipper Profitability by Agent' report, when run, will prompt the User for the following information:
-
The choice between a 'Summary' or 'Detail' report:
-
The Summary report lists the 'Shipper' and the number of 'Bills/Trips/Legs' attached to it, the shipment 'Weight' and 'Total 'Charges', as well as the 'Loaded/Empty/Total Miles', 'Carrier/Driver/Power/Trailer/Total Costs', 'Net Margin', 'Revenue per Mile', 'Profitability per Mile', and 'Dead Head' totals. A 'Totals' line appears at the end of the data.
The records are sorted by 'Sales Agent', 'Shipper' and their 'Leg Date'. -
The Detailed report lists all of the information found in the 'Summary' report, as well as breakdown of the individual 'Trip' information from the Freight Bills.
-
A 'Starting Date' to define the beginning of the Trip Date Range.
-
An 'Ending Date' to define the closing of the Trip Date Range.
-
The Client ID Code of a specific Sales Rep. Most Users will select the default ('*') to include all Sales Representatives, but you may select the 'search button' value and enter a specific Client ID in the space provided to filter on one specific Sales Rep.
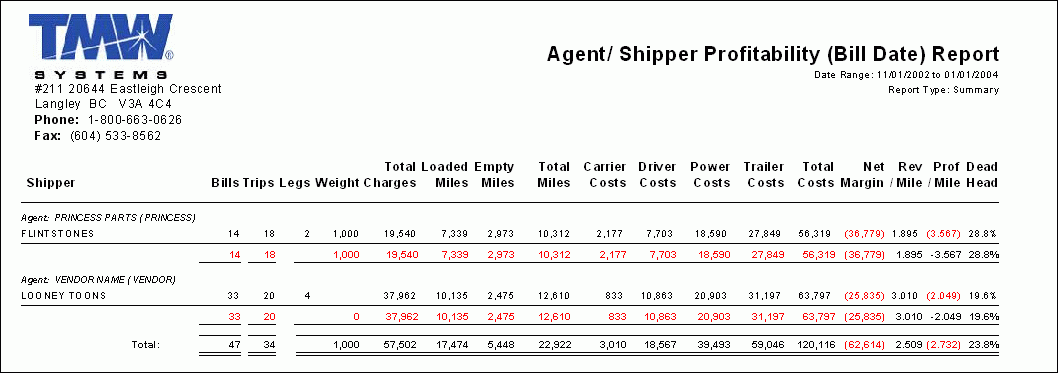
Shipper Profitability by Agent by Bill Date
The 'Shipper Profitability by Agent by Bill Date' report, when run, will prompt the User for the following information:
-
The choice between a 'Summary' or 'Detail' report:
-
The Summary report lists the 'Shipper' and the number of 'Bills/Trips/Legs' attached to it, the shipment 'Weight' and 'Total 'Charges', as well as the 'Loaded/Empty/Total Miles', 'Carrier/Driver/Power/Trailer/Total Costs', 'Net Margin', 'Revenue per Mile', 'Profitability per Mile', and 'Dead Head' totals. A 'Totals' line appears at the end of the data.
The records are sorted by 'Sales Agent', 'Shipper' and their 'Bill Date'. -
The Detailed report lists all of the information found in the 'Summary' report, as well as breakdown of the individual 'Trip' information from the Freight Bills.
-
A 'Starting Date' to define the beginning of the Trip Date Range.
-
An 'Ending Date' to define the closing of the Trip Date Range.
-
The Client ID Code of a specific Sales Agent. Most Users will select the default ('*') to include all Sales Agents but you may select the 'search button' value and enter a specific Client ID in the space provided to filter on one specific Sales Agent.
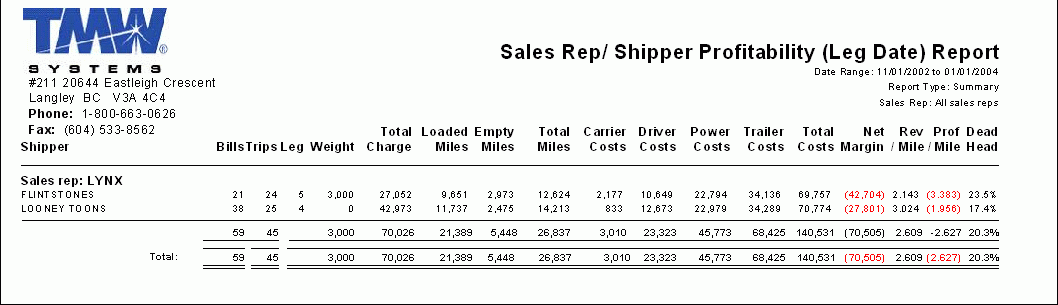
Shipper Profitability by Sales Rep
The 'Shipper Profitability by Sales Rep' report, when run, will prompt the User for the following information:
-
The choice between a 'Summary' or 'Detail' report:
-
The Summary report lists the 'Sales Rep.' and the number of 'Bills/Trips/Legs' attached to it, the shipment 'Weight' and 'Total 'Charges', as well as the 'Loaded/Empty/Total Miles', 'Carrier/Driver/Power/Trailer/Total Costs', 'Net Margin', 'Revenue per Mile', 'Profitability per Mile', and 'Dead Head' totals. A 'Totals' line appears at the end of the data.
The records are sorted by 'Sales Rep.', 'Shipper' and their 'Leg Date'. -
The Detailed report lists all of the information found in the 'Summary' report, as well as breakdown of the individual 'Trip' information from the Freight Bills.
-
A 'Starting Date' to define the beginning of the Trip Date Range.
-
An 'Ending Date' to define the closing of the Trip Date Range.
-
The Client ID Code of a specific Sales Rep. Most Users will select the default ('*') to include all Sales Representatives, but you may select the 'search button' value and enter a specific Client ID in the space provided to filter on one specific Sales Rep.
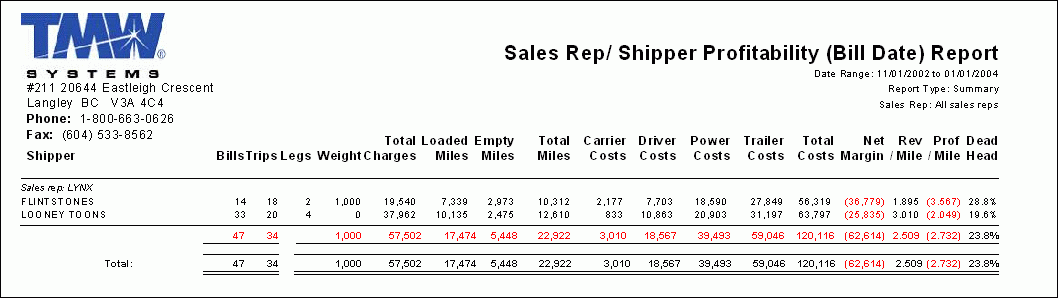
Shipper Profitability by Sales Rep by Bill Date
The 'Shipper Profitability by Agent by Bill Date' report, when run, will prompt the User for the following information:
-
The choice between a 'Summary' or 'Detail' report:
-
The Summary report lists the 'Shipper' and the number of 'Bills/Trips/Legs' attached to it, the shipment 'Weight' and 'Total 'Charges', as well as the 'Loaded/Empty/Total Miles', 'Carrier/Driver/Power/Trailer/Total Costs', 'Net Margin', 'Revenue per Mile', 'Profitability per Mile', and 'Dead Head' totals. A 'Totals' line appears at the end of the data.
The records are sorted by 'Sales Rep.', 'Shipper' and their 'Bill Date'. -
The Detailed report lists all of the information found in the 'Summary' report, as well as breakdown of the individual 'Trip' information from the Freight Bills.
-
A 'Starting Date' to define the beginning of the Trip Date Range.
-
An 'Ending Date' to define the closing of the Trip Date Range.
-
The Client ID Code of a specific Sales Representative. Most Users will select the default ('*') to include all Sales Reps but you may select the 'search button' value and enter a specific Client ID in the space provided to filter on one specific Sales Rep.
Shipper Profitability by State
The 'Shipper Profitability by State' report, when run, will prompt the User for the following information:
-
The choice between a 'Summary' or 'Detail' report:
-
The Summary Report lists the 'Shipper', 'Bills', 'Trips', Trip 'Legs', 'Weight' and 'Miles' information, followed by a host of different 'Cost' values (Power Unit, Driver, Trailer, etc.). A 'Total' of costs is given, as well as a 'Net Margin' value, 'Revenue/mile' and 'Profitability/Mile' and 'Dead Head' values.
The records are ordered by their 'Shipper', and a 'Total' is summarized for each of the columns at the end of the report. -
The Detailed report lists all of the information found in the 'Summary' report, as well as breakdown of the individual 'Trip' information from the Freight Bills.
-
A 'Starting Date' to define the beginning of the Trip Date Range.
-
An 'Ending Date' to define the closing of the Trip Date Range.
-
A 'Starting State' to define the beginning of the State Range. The 'State Range' will limit the displayed Freight Bills to those that have Zone Codes that fall within the Range defined by the 'Starting' and 'Ending' State values.
-
An 'Ending State' to define the closing of the State Range. The 'State Range' will limit the displayed Freight Bills to those that have Zone Codes that fall within the Range defined by the 'Starting' and 'Ending' State values.
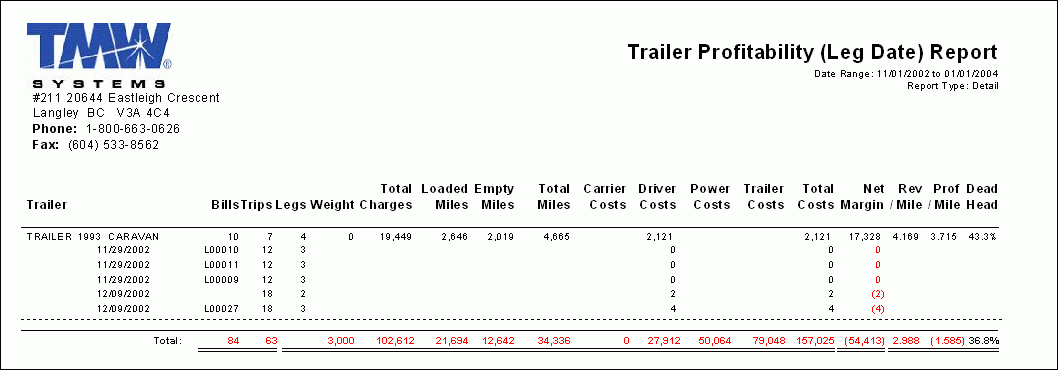
Trailer Profitability
The 'Trailer Profitability' report, when run, will ask for either a 'Summary' or 'Detail' report level, and a 'Starting' and 'Ending' Date that will determine the report’s Date Range.
-
The Summary Report lists the 'Trailer', 'Bills', 'Trips', Trip 'Legs', and 'Weight' information, followed by a host of different 'Cost' values (Power Unit, Driver, Trailer, etc.). A 'Total' of costs is given, as well as a 'Net Margin' value, 'Revenue/mile' and 'Profitability/Mile' and 'Dead Head' values.
The records are ordered by their 'Leg Date', and a 'Total' is summarized for each of the columns at the end of the report. -
The Detailed report lists all of the information found in the 'Summary' report, as well as breakdown of the individual 'Trip' information from the Freight Bills, and orders the records by their associated 'Trailer'.
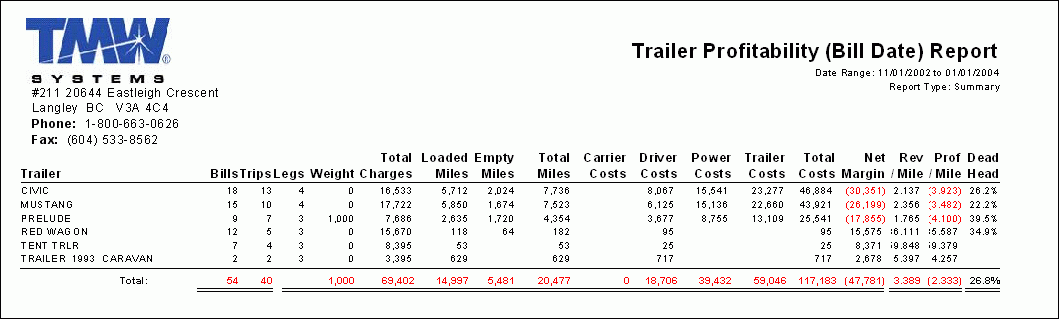
Trailer Profitability by Bill Date
The 'Trailer Profitability by Bill Date' report, when run, will ask for either a 'Summary' or 'Detail' report level, and a 'Starting' and 'Ending' Date that will determine the report’s Date Range.
-
The Summary Report lists the 'Trailer', 'Bills', 'Trips', Trip 'Legs', and 'Weight' information, followed by a host of different 'Cost' values (Power Unit, Driver, Trailer, etc.). A 'Total' of costs is given, as well as a 'Net Margin' value, 'Revenue/mile' and 'Profitability/Mile' and 'Dead Head' values. The records are ordered by their 'Bill Date', and a 'Total' is summarized for each of the columns at the end of the report.
-
The Detailed report lists all of the information found in the 'Summary' report, as well as breakdown of the individual 'Trip' information from the Freight Bills, and orders the records by their associated 'Trailer'.
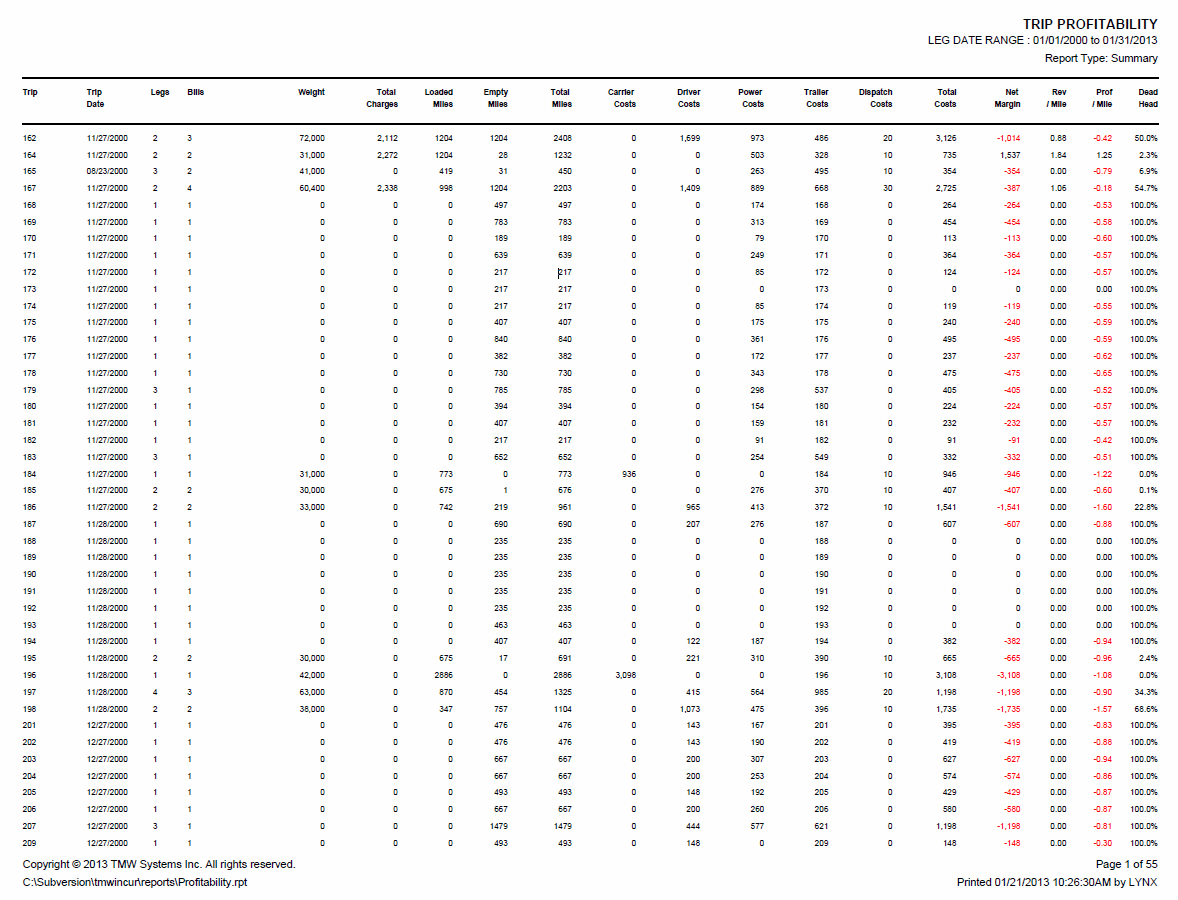
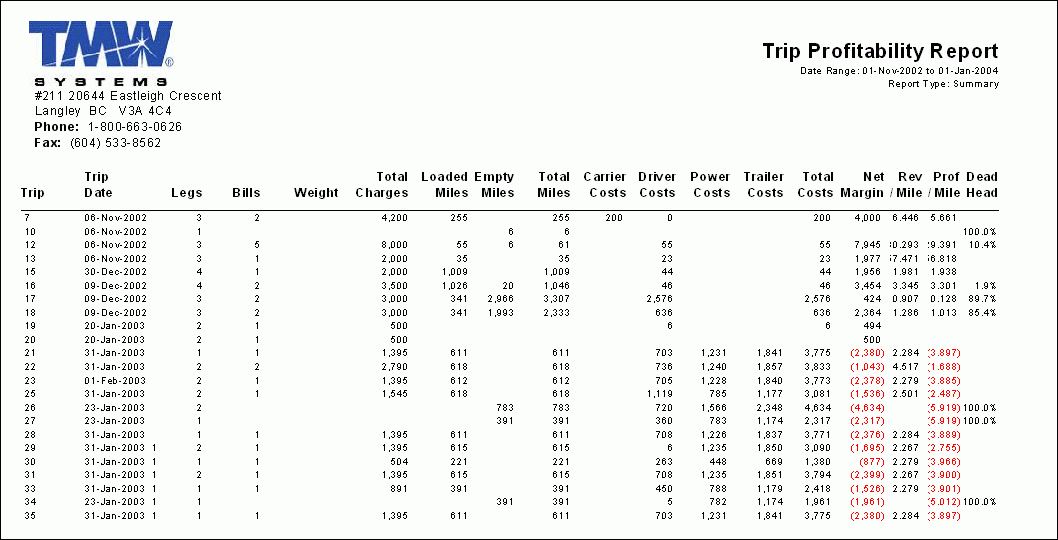
Trip Profitability
The 'Trip Profitability' report, when run, will ask for either a 'Summary' or 'Detail' report level, and a 'Starting' and 'Ending' Date that will determine the report’s Date Range.
-
The Summary Report lists the 'Trip #', 'Trip Date', 'Trip Legs', 'Bills', Weight' information, followed by a host of different 'Cost' values (Power Unit, Driver, Trailer, etc.). A 'Total' of costs is given, as well as a 'Net Margin' value, 'Revenue/mile' and 'Profitability/Mile' and 'Dead Head' values.
The records are ordered by their 'Trip #', and a 'Total' is summarized for each of the columns at the end of the report. -
The Detailed report lists all of the information found in the 'Summary' report, as well as breakdown of the individual 'Trip' information from the Freight Bills, and orders the records by their associated 'Trip'.
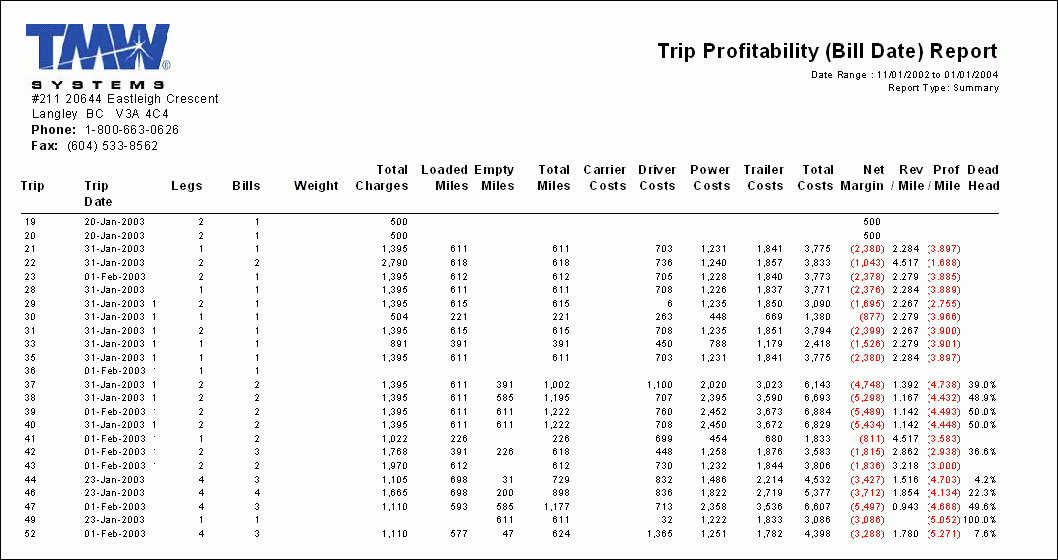
Trip Profitability by Bill Date
The 'Trip Profitability by Bill Date' report, when run, will ask for either a 'Summary' or 'Detail' report level, and a 'Starting' and 'Ending' Date that will determine the report’s Date Range.
-
The Summary Report lists the 'Trip #', 'Trip Date', 'Trip Legs', 'Bills', Weight' information, followed by a host of different 'Cost' values (Power Unit, Driver, Trailer, etc.). A 'Total' of costs is given, as well as a 'Net Margin' value, 'Revenue/mile' and 'Profitability/Mile' and 'Dead Head' values.
The records are ordered by their 'Trip #', and a 'Total' is summarized for each of the columns at the end of the report. -
The Detailed report lists all of the information found in the 'Summary' report, as well as breakdown of the individual 'Trip' information from the Freight Bills, and orders the records by their associated 'Trip'.
Service Standard Reports
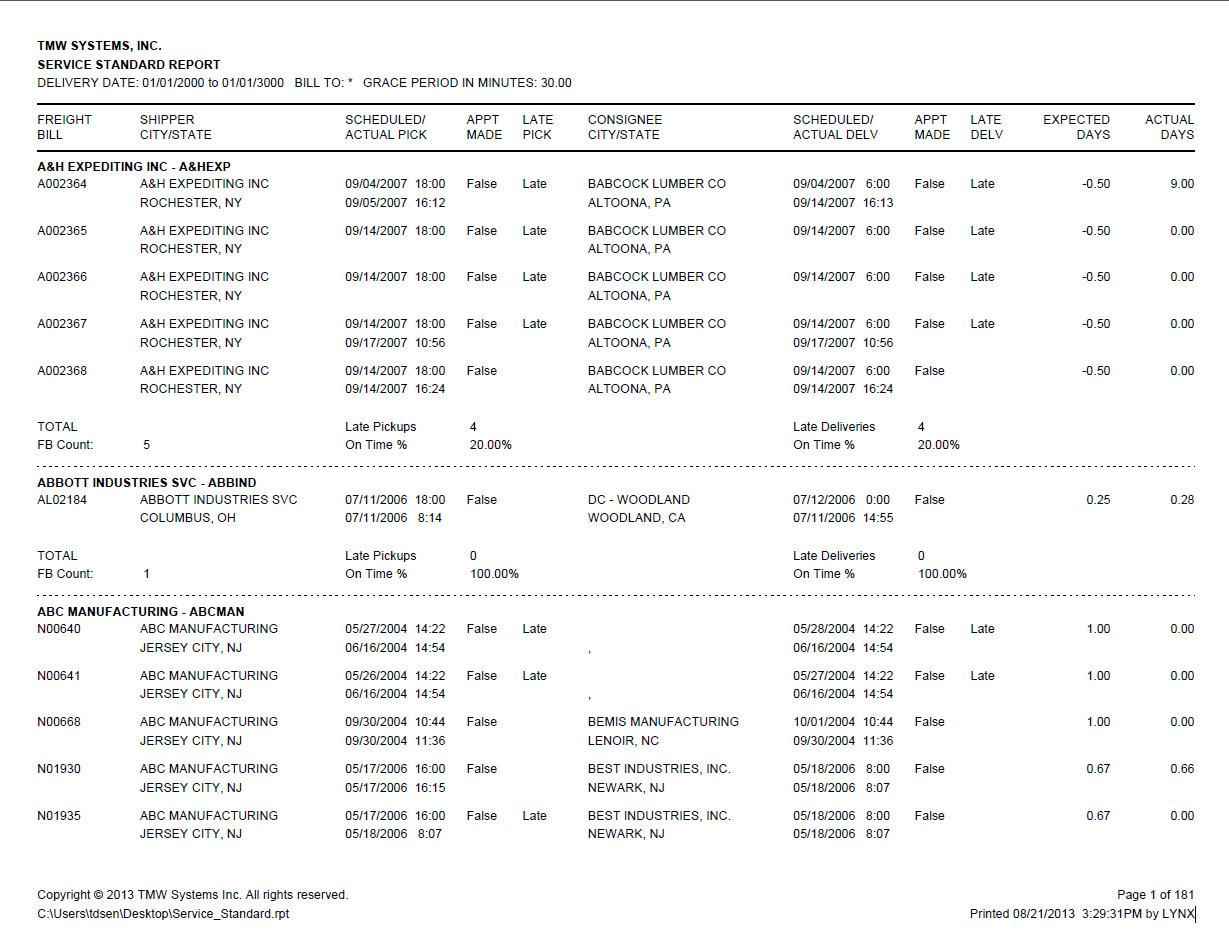
The 'Service Standard' Report is used as a tool for your company to measure the quality of service provided to customers. Generate reports that track the scheduled versus actual pickup/delivery times to give a late count and on time percentage. Your customers demand detailed information about their shipment; not only is this information available but your company can now quickly react to any problem areas.
Service Standard
This report shows you on time % for pickups and deliveries based on scheduled pickup and delivery dates vs. actual pickup and delivery dates. The report can be run by bill to customer or shipper and consignee locations. Loads are considered late if actual date is greater than the scheduled date. The Grace Period in Minutes parameter can be used to add a buffer to the actual dates. I.e. setting Grace Period in Minutes to 30 will consider a load that delivered 20 minutes late as being on time.
Bill Count Top 50 Reports
The 'Bill Count Top 50' Reports let you closely monitor the customers that are vital to your bottom line. Keeping track of your highest volume shippers, consignees, and callers will help you anticipate changes in your operation and in the industry as a whole.
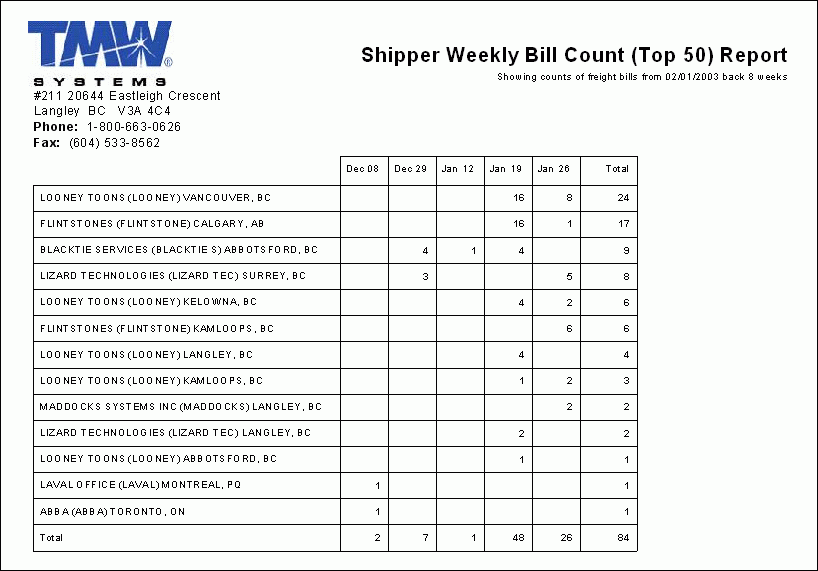
These reports will show you the number of freight bills for your TOP 50 shippers (based on bill count) that have been entered during the past 8 weeks. The report is divided into the weekly activity of each of your Top 50 customers, with final totals for each. This short report is shown in order of your biggest customer to the smallest. Watching these numbers for trends such as customers with sudden drop offs in volume, or even unexplained large increases in volume helps you react to changes and adjust aspects of your operation.
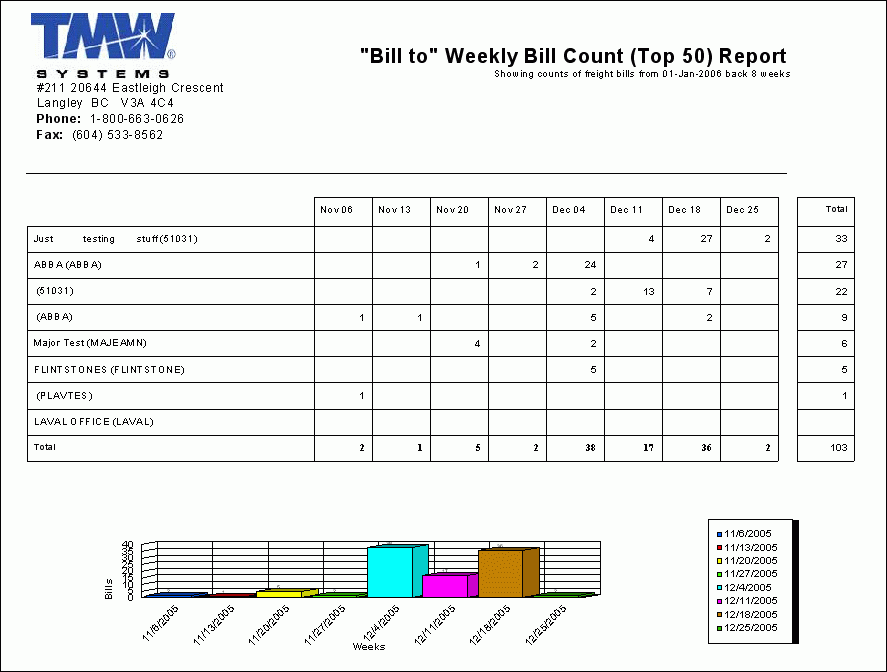
Bill To Weekly Bill Count Top 50
When the 'Bill-To Weekly Bill Count Top 50' report is run, the User will be prompted to enter a 'Start Date'. The report will then output all of the 'Bill To' Customers in your system that have had Freight Bills created for them in the past 8 weeks (beginning with the date you provided). The Customers will be listed in order of most Freight Bills, and you will see a table of the number of Freight Bills issued for a given period. At the bottom is a graphical representation of Freight Bill activity for you Company over the past 8 weeks.
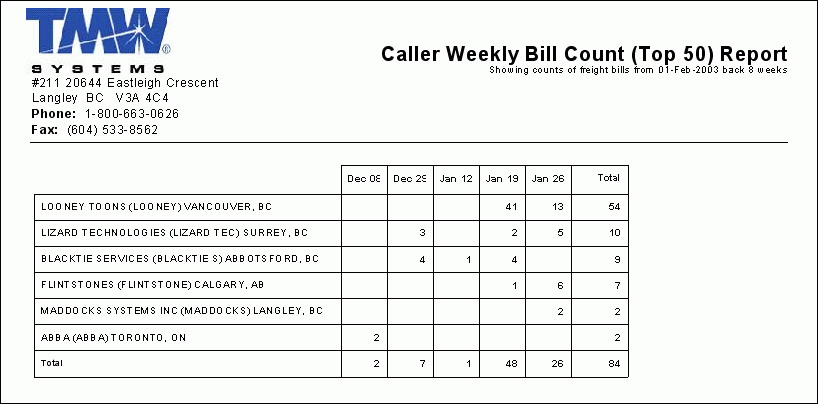
Caller Weekly Bill Count Top 50
When the 'Caller Weekly Bill Count Top 50' report is run, you will be asked to provide a 'Date' value. This value will be used as the starting point, and all of the Freight Bills from this date and back 8 weeks will be used. The Customer with the most Freight Bills (as 'Caller') will appear at the top of the list, followed by the second Customer. Their Freight Bill usage will be summarized on a 'weekly' basis in a simple table.
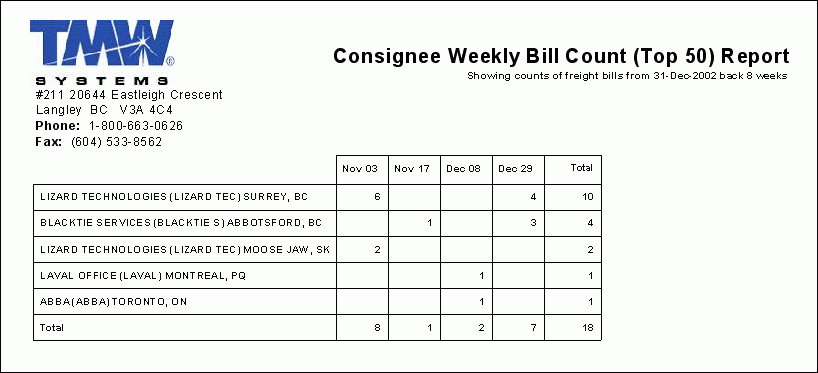
Consignee Weekly Bill count Top 50
When the 'Consignee Weekly Bill Count Top 50' report is run, you will be asked to provide a 'Date' value. This value will be used as the starting point, and all of the Freight Bills from this date and back 8 weeks will be used. The Consignee with the most Freight Bills will appear at the top of the list, followed by the second Consignee. Their Freight Bill usage will be summarized on a 'weekly' basis in a simple table.
Shipper Weekly Bill Count Top 50
When the 'Shipper Weekly Bill Count Top 50' report is run, you will be asked to provide a 'Date' value. This value will be used as the starting point, and all of the Freight Bills from this date and back 8 weeks will be used. The Shipper with the most Freight Bills will appear at the top of the list, followed by the second Shipper. Their Freight Bill usage will be summarized on a 'weekly' basis in a simple table.
Mileage Analysis Reports
The 'Mileage Analysis' Reports are best used to assure you are properly utilizing your investment in power units and trailers. Reports can be created for 5, 6 or 7 day workweeks with mileage totals presented for one day, one week or a 30-day period. Targets can be used as guidelines to assure your operations personnel are efficiently utilizing the equipment they are entrusted with. Also average revenue per day and per week can be displayed for quick projections of potential profitability.
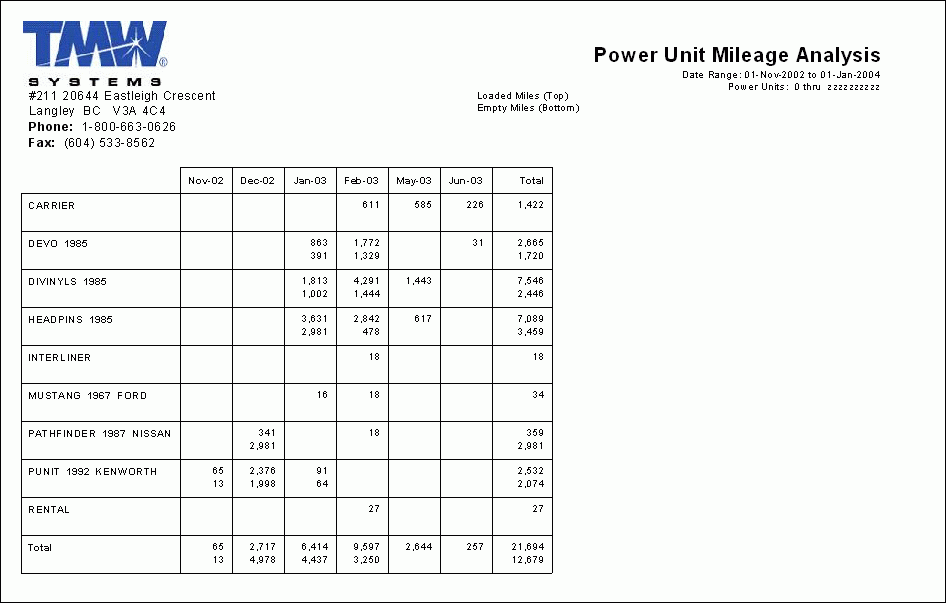
Power Unit Mileage Analysis
When the 'Power Unit Mileage Analysis' report is run, you will be required to provide the following:
-
A 'Starting Date' to define the beginning of the Trip Date Range.
-
An 'Ending Date' to define the closing of the Trip Date Range.
-
A 'Starting Power Unit' code to define the beginning of the Power Unit Range (most Users should simply leave the default '0' here to include ALL Power Units).
-
An 'Ending Power Unit' code to define the closing of the Power Unit Range (most Users should simply leave the default 'zzzzzzzzzz' here to include ALL Power Units).
-
The report will generate a simple Table detailing the Mileage use of the Power Units in your system, with 'Loaded Miles' data displayed above 'Empty Miles' data.
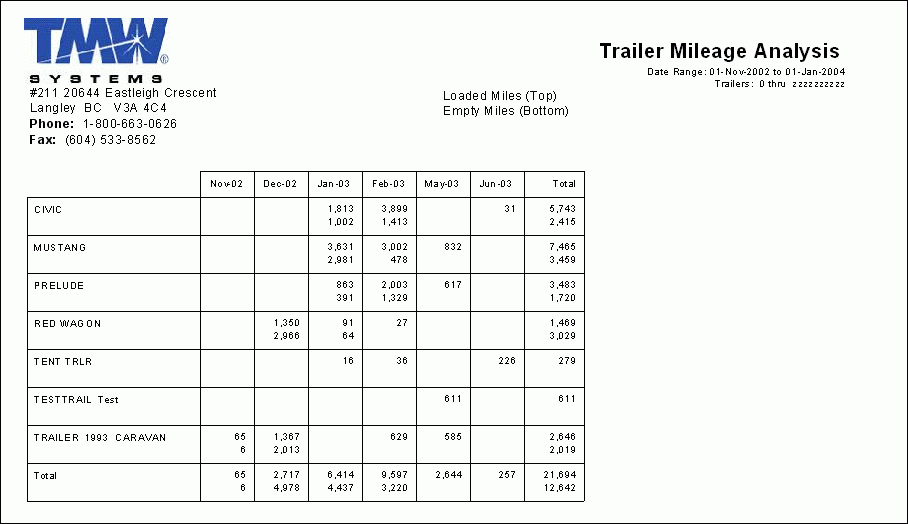
Trailer Mileage Analysis
When the 'Trailer Mileage Analysis' report is run, you will be required to provide the following:
-
A 'Starting Date' to define the beginning of the Trip Date Range.
-
An 'Ending Date' to define the closing of the Trip Date Range.
-
A 'Starting Trailer' code to define the beginning of the Trailer Range (most Users should simply leave the default '0' here to include ALL Power Units).
-
An 'Ending Trailer' code to define the closing of the Trailer Range (most Users should simply leave the default 'zzzzzzzzzz' here to include ALL Power Units).
The report will generate a simple Table detailing the Mileage use of the Trailers in your system, with 'Loaded Miles' data displayed above 'Empty Miles' data.
Top 40 Revenue Reports
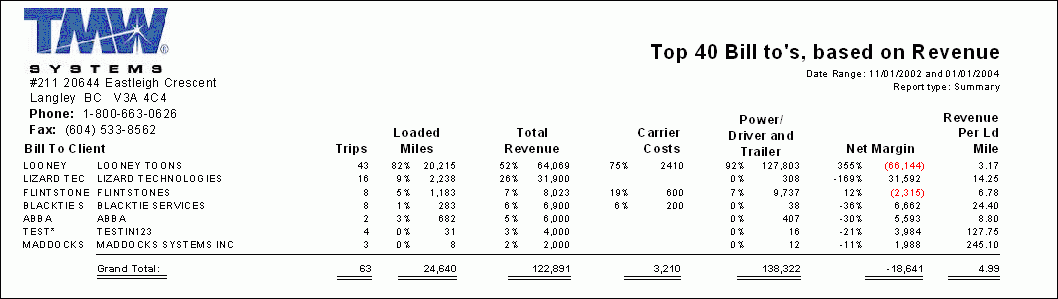
The 'Top 40 Revenue' Report will show you your customers based on the amount of total revenues they bring into your company. These reports will demonstrate the percentage of the total sales each customer is responsible for, and then shows you the total power, trailer, driver and carrier cost attributed to this same customer.
Displayed as a percentage of your total costs, this report allows you to correlate your costs versus the revenue generated from each of your top customers. For example, a customer that may represent 20% or your total revenue could actually dominate 30 % or your trailer costs and 28 % of your overall cost.
Top 40 Bill To’s, Based on Revenue 8.0
The 'Top40 Bill To’s, Based on Revenue (8.0)' report, when run, will prompt the User for 'Starting' and 'Ending' values to constitute the Trip Date Range. The report will display the 'Bill-To' Code with the most Freight Bills first, followed in order by the other 'Bill-To' codes in the system. The report also displays the 'Trips', 'Loaded Miles', 'Total Revenue' percentage, 'Carrier Costs', 'Power/Driver/Trailer Costs', and the 'Net Margin' and 'Revenue per Loaded Miles values.
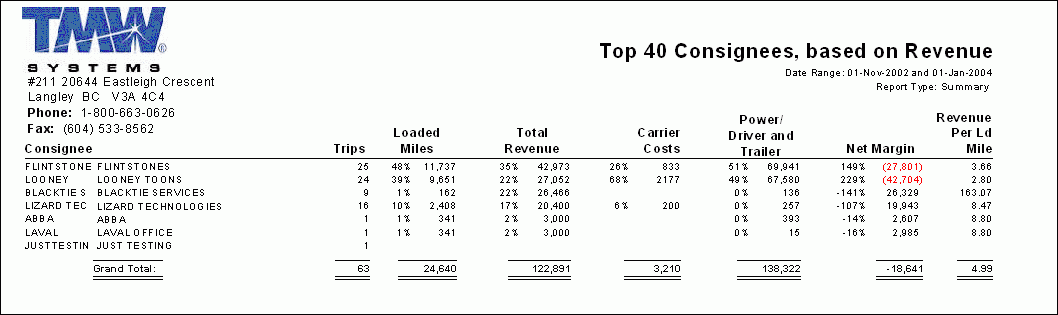
Top 40 Consignees, Based on Revenue 8.0
The 'Top40 Consignees, Based on Revenue (8.0)' report, when run, will prompt the User for 'Starting' and 'Ending' values to constitute the Trip Date Range.
The report will display the 'Consignee' Code with the most Freight Bills first, followed in order by the other 'Bill-To' codes in the system. The report also displays the 'Trips', 'Loaded Miles', 'Total Revenue' percentage, 'Carrier Costs', 'Power/Driver/Trailer Costs', and the 'Net Margin' and 'Revenue per Loaded Miles values.
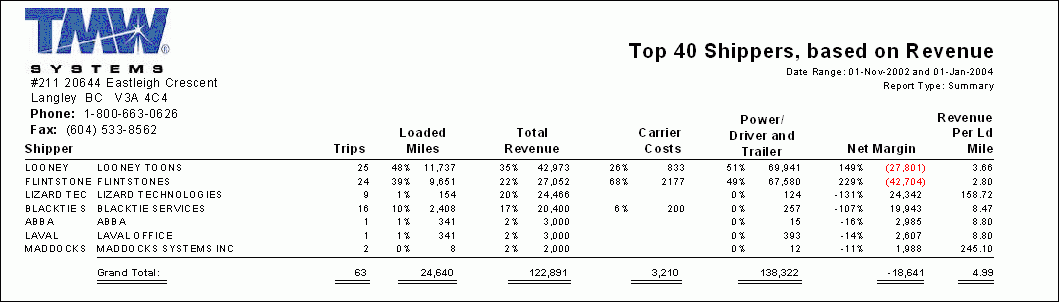
Top 40 Shippers, Based on Revenue 8.0
The 'Top40 Shippers, Based on Revenue (8.0)' report, when run, will prompt the User for 'Starting' and 'Ending' values to constitute the Trip Date Range.
The report will display the 'Shipper' Code with the most Freight Bills first, followed in order by the other 'Bill-To' codes in the system. The report also displays the 'Trips', 'Loaded Miles', 'Total Revenue' percentage, 'Carrier Costs', 'Power/Driver/Trailer Costs', and the 'Net Margin' and 'Revenue per Loaded Miles values.
Revenue Analysis Reports
The 'Revenue Analysis' reports are best used to assure that you are getting the proper utilization of your resources. Reports can be based on a 5, 6 or 7 day work week, with mileage totals presented for 'day', 'week' and '30 day' periods. These 'targets' can be used as guidelines to assure your operations personnel are efficiently utilizing the equipment they are entrusted with. Average revenue per day and per week are also shown for quick projections as to potential profitability.
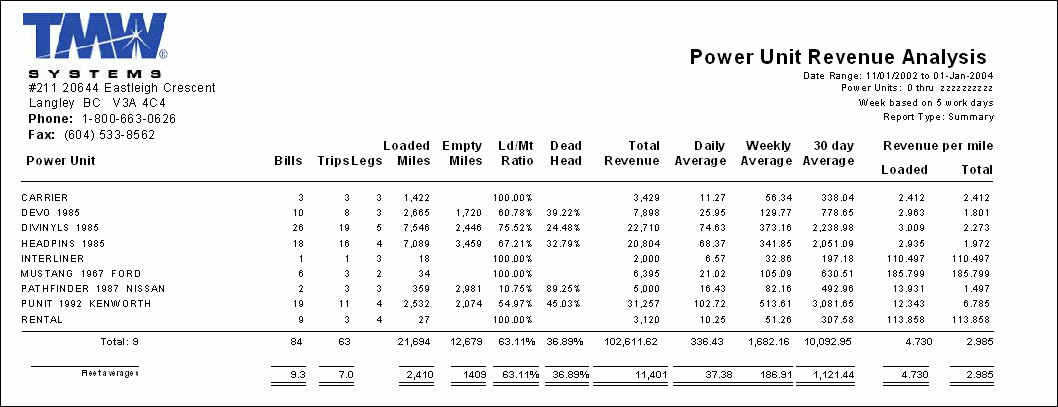
Power Unit Revenue Analysis
The 'Power Unit Revenue Analysis' report, when run, will prompt the User for the following information:
-
The choice between a 'Summary' or 'Detail' report:
-
The Summary report lists the 'Power Unit' and the number of 'Bills/Trips/Legs' attached to it, as well as the Power Unit’s 'Loaded/Empty Miles', 'Loaded/Empty Ratio', 'Dead Head', 'Total Revenue', 'Daily/Weekly/30 day' Averages and, finally the Power Unit’s 'Revenue per Mile (loaded/total). The report will also generate a 'Totals' line consisting of all the revenue for all of your Power Units.
-
The Detailed report lists all of the information found in the 'Summary' report, as well as breakdown of the individual 'Trip' information from the Freight Bills.
-
A 'Starting Date' to define the beginning of the Trip Date Range.
-
An 'Ending Date' to define the closing of the Trip Date Range.
-
The definition of the number of days that constitute a full work week for the Power Units (choose from either '5', '6' or '7').
-
A 'Starting Power Unit' code to define the beginning of the Power Unit Range (most Users should simply leave the default '0' here to include ALL Power Units).
-
An 'Ending Power Unit' code to define the closing of the Power Unit Range (most Users should simply leave the default 'zzzzzzzzzz' here to include ALL Power Units).
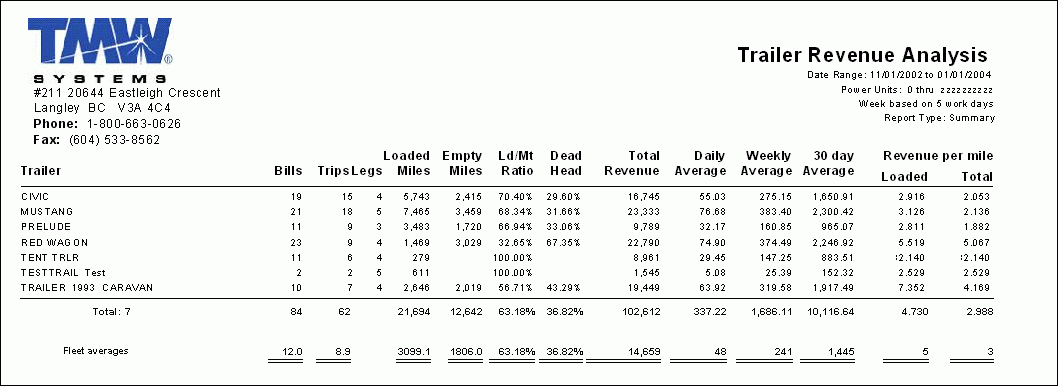
Trailer Revenue Analysis
The 'Trailer Revenue Analysis' report, when run, will prompt the User for the following information:
-
The choice between a 'Summary' or 'Detail' report:
-
The Summary report lists the 'Trailer' and the number of 'Bills/Trips/Legs' attached to it, as well as the Power Unit’s 'Loaded/Empty Miles', 'Loaded/Empty Ratio', 'Dead Head', 'Total Revenue', 'Daily/Weekly/30 day' Averages and, finally the Power Unit’s 'Revenue per Mile (loaded/total). The report will also generate a 'Totals' line consisting of all the revenue for all of your Power Units.
-
The Detailed report lists all of the information found in the 'Summary' report, as well as breakdown of the individual 'Trip' information from the Freight Bills, and orders the records by their associated 'Trailer'.
-
A 'Starting Date' to define the beginning of the Trip Date Range.
-
An 'Ending Date' to define the closing of the Trip Date Range.
-
The definition of the number of days that constitute a full work week for the Trailers (choose from either '5', '6' or '7').
-
A 'Starting Power Unit' code to define the beginning of the Trailer Range (most Users should simply leave the default '0' here to include ALL Power Units).
-
An 'Ending Power Unit' code to define the closing of the Trailer Range (most Users should simply leave the default 'zzzzzzzzzz' here to include ALL Power Units).
Other Reports
'Customer Last Activity Reports' and 'No Recent Activity Reports' are excellent tools for identifying which callers, shippers, and consignees have not used your services for a given time period but have used it previously. A great tool to determine if your customers are using a competitor or if they now have different shipping requirements.
Customer Last Activity
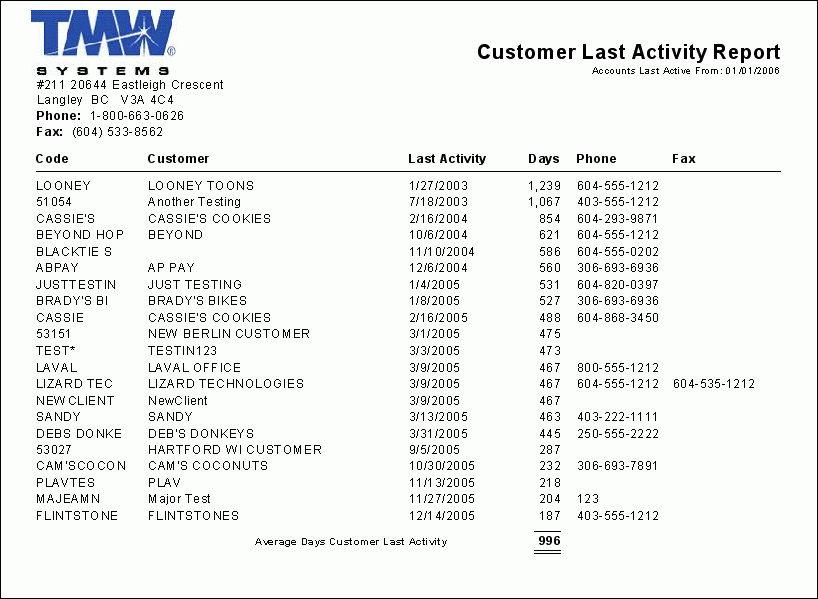
The 'Customer Last Activity' Report is an excellent tool for identifying which 'Callers', 'Shippers' and 'Consignees' have not used your services in the last 'x' days, but had used your services in the previous 'y' days. Great for identifying which of your Customers may be 'trying out' one of your competitors!
When this report is run, you will be prompted to enter a 'Date' value. The report will then run, and will produce a list of your Customers and the date of their 'Last Activity' (having a Freight Bill entered, etc.). The report displays the Customer’s 'ID', 'Name', 'Date of Last Activity', 'Days' since Last Activity' and some 'Contact' information. At the end of the report, an 'Average Days since Last Activity' value is given.
No Recent Activity
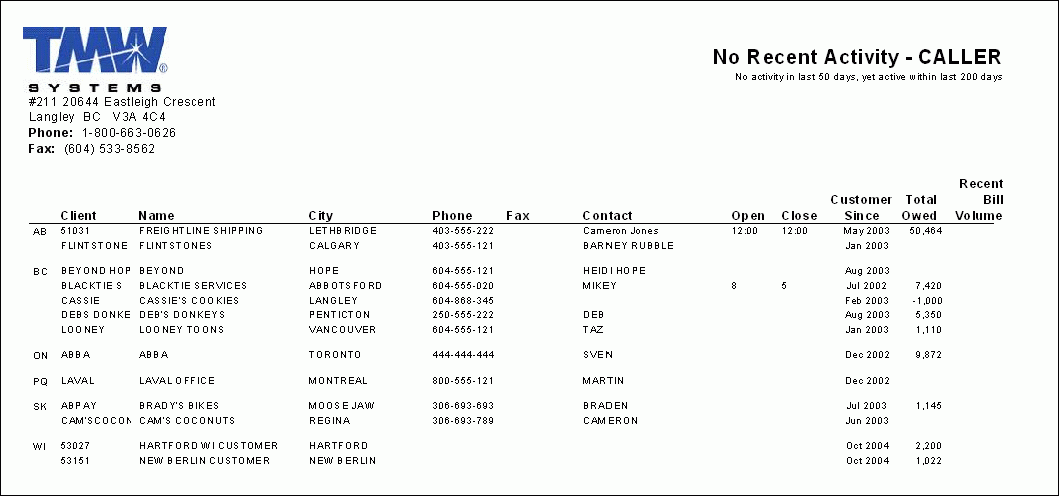
This report takes no additional input and produces a list of Clients/Customers in your system that have not been 'Active' (been included on a Freight Bill, for example) for the last 'x' calendar days, yet have been 'Active' in the past 'y' calendar days- great for identifying which of your Customers may be 'trying out' one of your competitors!
When the 'No Recent Activity' report is run, you will be required to make a few selections:
-
Which type of report ('Callers', 'Shippers', 'Consignees' or 'Bill To Clients').
-
No Activity in last __* (this number forms the 'x' value mentioned in the description of the report above).
-
Yet Active within __* (this number forms the 'y' value mentioned in the description of the report above).
-
The report will display the Client’s 'ID', 'Name', 'City', 'Contact Information', 'Operating Hours' and some historical data such as: 'Customer Since', 'Total Owed' and 'Recent Bill Volume'.
'Driver Call In', 'List of Available Loads', 'Loads Without BOL' and 'Spot Loaded' Reports can be used as a supplement to your online dispatching tools and planning activities.
Driver Call In
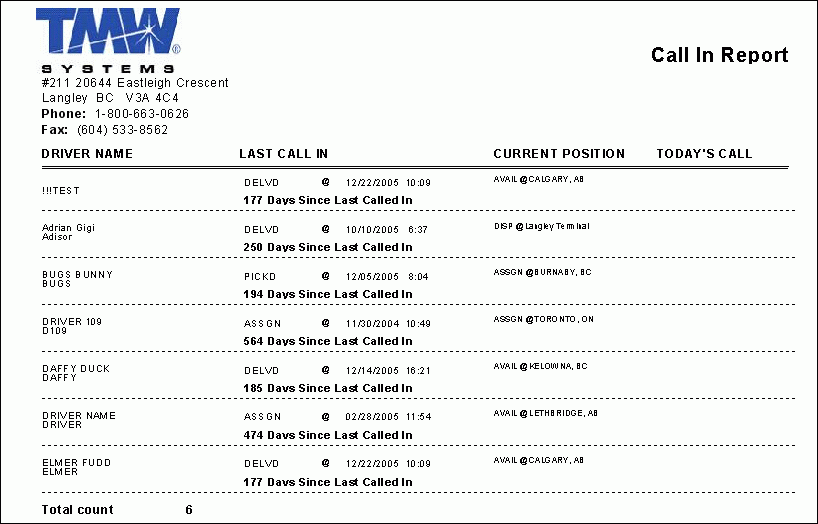
When this report is run, you will be prompted to enter in a list of Driver ID values, or simply to select the default value of '*' (all Drivers). The report will provide a list of Drivers, their 'Last Call In' date, their 'Current Position' and the details of 'Today’s Call' (if available).
List of Available Loads
This report will produce a listing of all Freight Bills in your system with a status of 'AVAIL', broken down by Zone Code. The report will ask you for a 'Date' value, and will use this date as the starting value, taking all reports with 'AVAIL' status before this date. The report lists the 'Zone Code', followed by the Freight Bill information ('Bill #/Bill To', 'Pick Up Information', 'Delivery Information' and any included 'Trace Numbers').
Loads without BOL
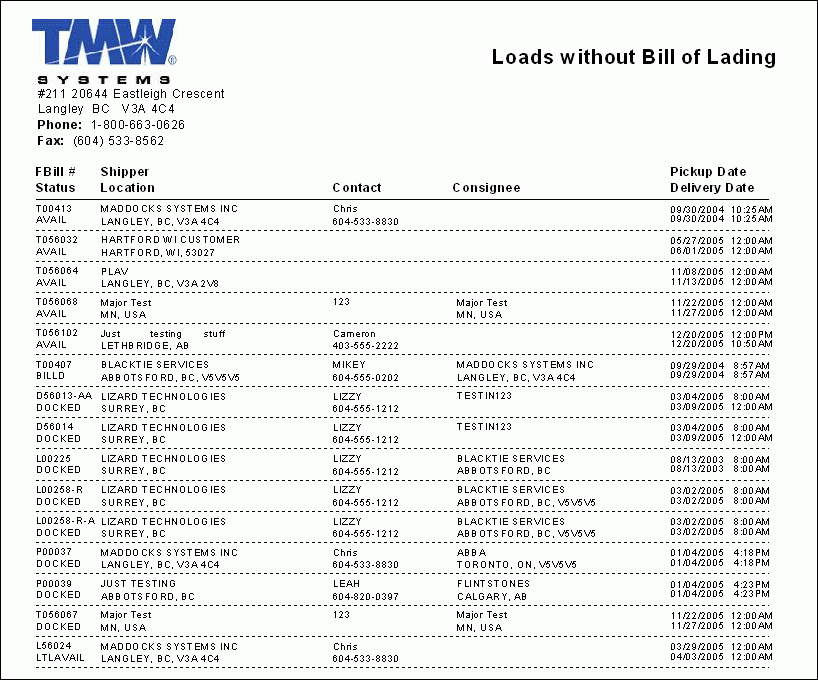
The 'Loads without BOL' report is a great maintenance report that you can use to supplement your online Dispatching tools, as well as for planning activities.
When this report is run, it will produce a list of all of the Freight Bills currently in your system without a Bill of Lading receipt. The report lists the 'Freight Bill #/Status', ' Shipper Code/Shipper Location', the 'Contact' person for the Shipper, the 'Consignee' and 'Pickup/Delivery Date' information.
Spot Loaded
The 'Spot Loaded' report is a great maintenance report that you can use to supplement your online Dispatching tools, as well as for planning activities.
This report will provide a list of all Trailers in your system that are currently 'Spot Loaded'. The report provides the Trailer’s 'Location', 'Trailer #', 'Equipment Type', 'Status', the date is was 'Spotted Since' and the total number of 'Days Spotted'. At the end of the report the 'Total Spotted' average is displayed.
'Driver Experience', 'Termination' and 'Turnover' Reports are key to managing your operation. They help answer questions like: How often are your drivers turning over? Are you losing new or experienced drivers? Having access to these details can help you maintain customer service levels, reduce accidents and reduce claims.
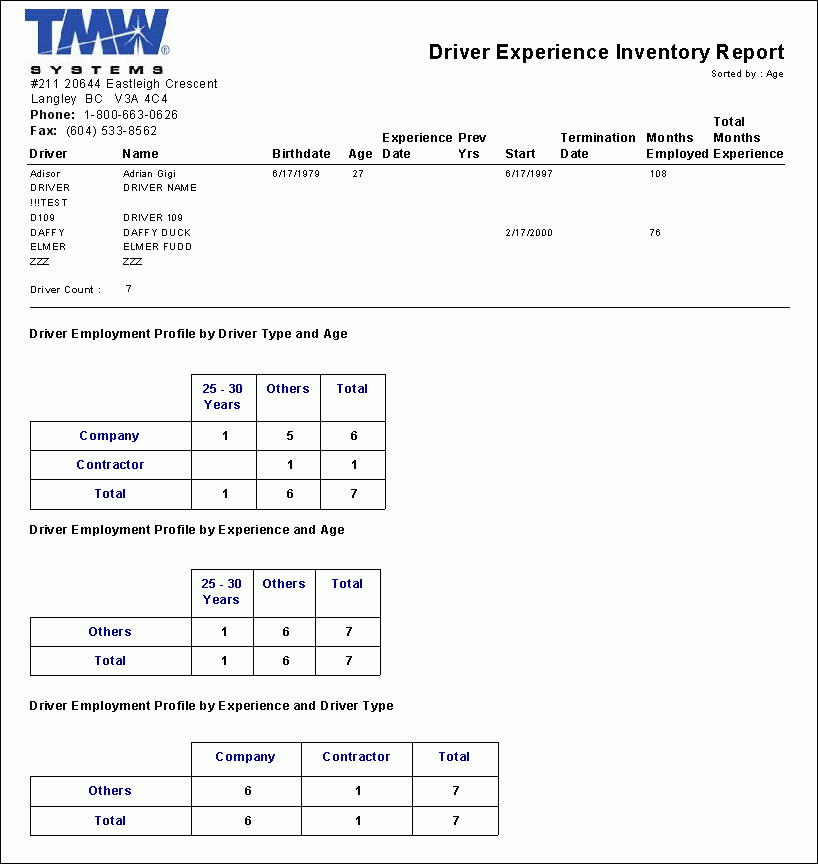
Driver Experience
This report provides a breakdown of the Drivers in your system and some details concerning their 'Age' and 'Employment Experience', as well as some general tables regarding Driver Employment in your Company. When run, this report will ask the User to select which 'Grouping' value will be used. Select either 'Total Experience', 'Age', 'Pre-Employment Experience' or 'Months Employed' (the value you select will determine how the records are sorted on the report).
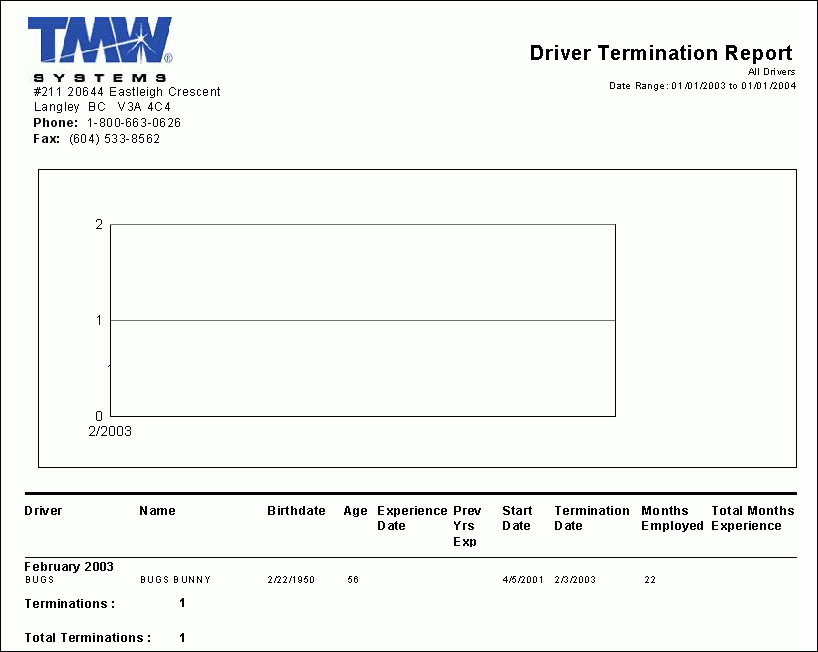
Driver Termination
This report provides a breakdown of any Driver Terminations that have occurred in your Company’s history. The report begins with a graphical chart showing the amount of terminations across a Date Range, then provides a breakdown of the Drivers that were terminated, including the Driver’s 'ID', 'Name', 'Age' information and 'Work Experience' with your Company.
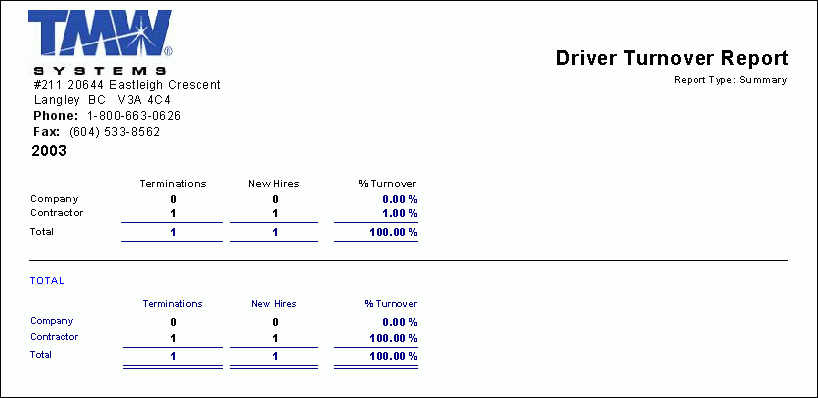
Driver Turnover
This report provides a listing of Driver 'Terminations' and 'Hires', as well as a 'Turnover' percentage , broken down by year. The User will be asked to select either a 'Summary' or 'Detailed' report:
-
The Summary report provides a list of 'Terminations', 'Hires' and the '% Turnover' value they generate, as well as a 'Total' list, including all three of these values.
-
The Detailed report provides all the data listed in the Summary report, but also provides a short breakdown of the Driver IDs that have been hired and/or terminated, and also provides some tables of general Driver information in your system.
Additional reports are also available to help complete the profitability picture, and give better environment for decision making and future planning.
Inbound Outbound Analysis by State
When this report is run, you will be prompted to answer either 'Yes' or 'No' to the following question:
"Suppress state combinations with no activity in first INTERVAL PERIOD?"
What this question means is that if there is no activity between 2 States Codes, the report will 'suppress' (remove) the detail line for that combination of State Codes. If you answer 'No' to this question, you will (most likely) see many State combination lines filled with only of zeroes on the outputted report. Most users will select 'Yes' in order to obtain a clean-looking report.
You will also be asked for a 'Date/Time' value (in the format YYYY-MM-DD hh:mm:ss) and an 'Interval Date' value, which will be multiplied by a value of 4 to determine the amount of 'Days Back' the report will include (for example: enter '91' to include the previous year).
The report will generate a list of records, sorted by the 'From State', 'To State' and 'Back To State' and will include the following information for each: 'Load Count' and 'Revenue/mile'. Following this information are some totals: 'Blended Average' and 'Trend' values for different breakdowns.
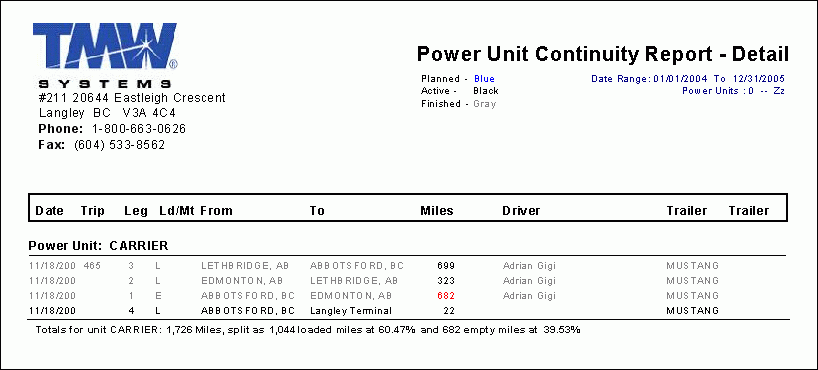
Power Unit Continuity
This report provides a breakdown of Power Unit Trip Activity on a leg-by-leg basis (showing you the 'Continuous' movement of your Power Unit), broken down by individual Power Units. The report asks you for a choice of 'Summary' or 'Detail' reports, a 'Date Range' and a 'Power Unit Range' (default values '0' and 'Zz' conduct a search of all available Power Units). Depending on your type of report, the results will differ:
-
The Summary report lists the 'Date', 'Trip #', 'Leg #' and 'Loaded/Empty' status of each Trip Leg, as well as the 'From' and 'To' zones, 'Miles' per Leg and the attached 'Driver' and 'Trailer(s)'. Some useful 'Total' information follows the breakdown of each Power Unit.
-
The Detailed report lists the 'Date', 'Trip #', 'Leg #' and 'Loaded/Empty' status of each Trip Leg, as well as the 'From' and 'To' zones, 'Miles' per Leg and the attached 'Driver' and 'Trailer(s)'. Some useful 'Total' information follows the breakdown of each Power Unit.