Customizing reports
| The procedures and images in these topics reflect Crystal Reports XI Release 2. For more information on later versions, see the corresponding User Guide available on the Crystal Reports documentation site. |
Record selection
You can tailor existing reports to show or hide data.
For example, suppose we have a report that includes freight bills with a status of Quote (Q). To remove those bills from the report:
-
Go to View > Preview to see the original report results.
-
Go to Report > Select Expert.
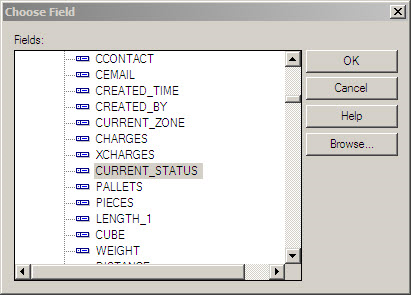
The Choose Field window opens. -
In the TLORDER table, statuses are represented by the CURRENT_STATUS field. Select that field and click OK.
-
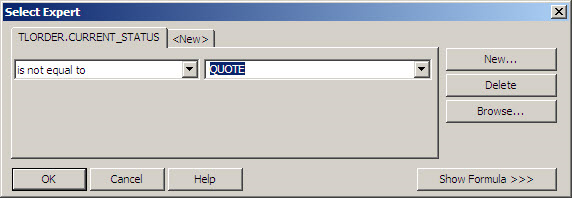
You then determine how you want records containing the selected field to be displayed in the report.In this case, we want to exclude records with a CURRENT_STATUS of QUOTE.Select the appropriate values in the fields provided and click OK.
-
Crystal Reports provides two options:
-
Use Saved Data
Crystal Reports refreshes the report using just the data that was in your database when you previewed the report in Step 1 -
Refresh Data
Crystal Reports refreshes the report using the data that currently exists in your database, including any new or updated records
-
The report redisplays with the changes reflected.In our example, the report should appear without quote bills.
Grouping
You can use Crystal Reports' Group feature to collect report records into one or more groups.You can then use additional features to provide data that’s specific to those groups.
For example, suppose we have a revenue report that contains data from multiple Bill To companies across multiple states or provinces.We want to see the amount of revenue generated for each state.
-
Go to Insert > Group.
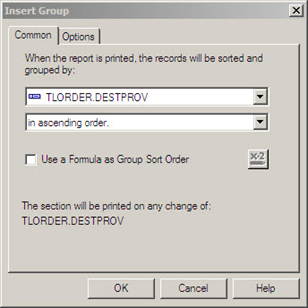
The Insert Group window opens. -
In the TLORDER table, the field we want to use for grouping is DESTPROV, which corresponds to the Bill To company’s state.
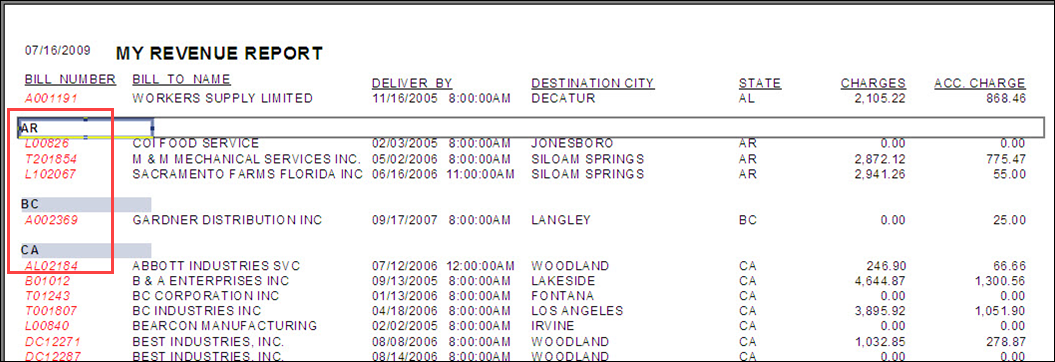
After clicking OK, the report redisplays with the records grouped by state or province.
Now let’s add subtotals to show the revenue by state/province.
-
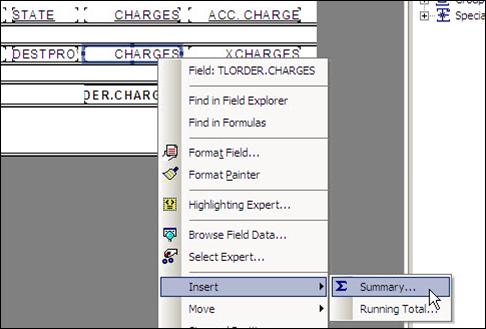
In Design view, right-click the CHARGES field.
-
In the menu that appears, go to Insert > Summary.
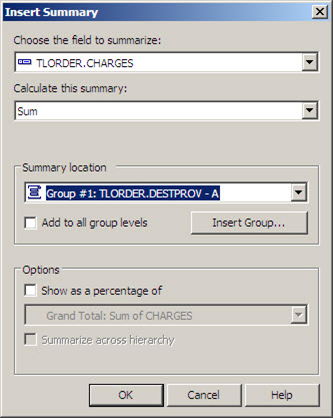
The Insert Summary window opens.
-
In the Summary location field, we select the group that we created previously, and click OK.
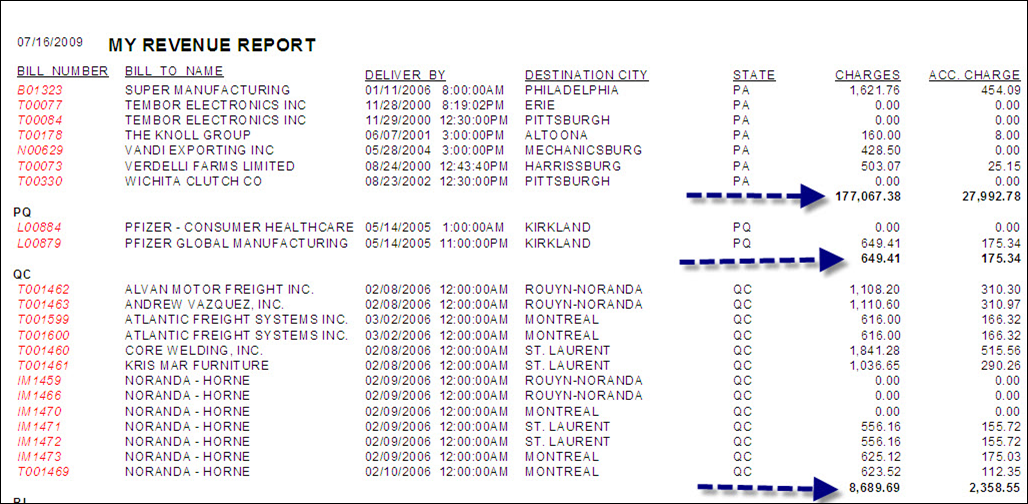
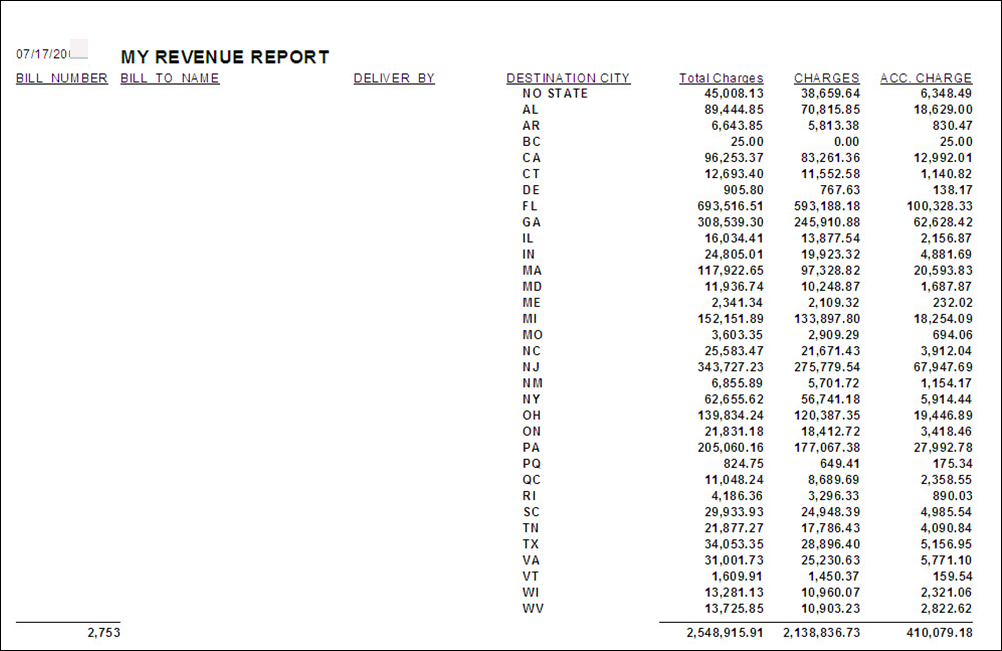
This illustration displays subtotals for regular charges and accessorial charges. To display accessorial subtotals, follow the same procedure using the XCHARGES field.
Page breaks
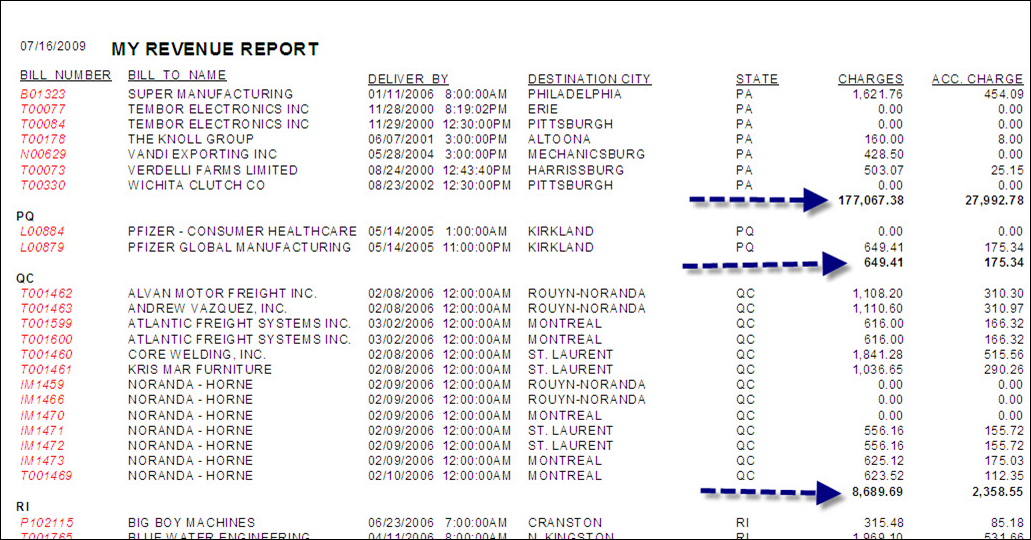
This illustration displays a report in which records are grouped by state/province. We want to insert a page break after each individual state/province.
-
Right-click one of the sections after which you want to insert a page break.
-
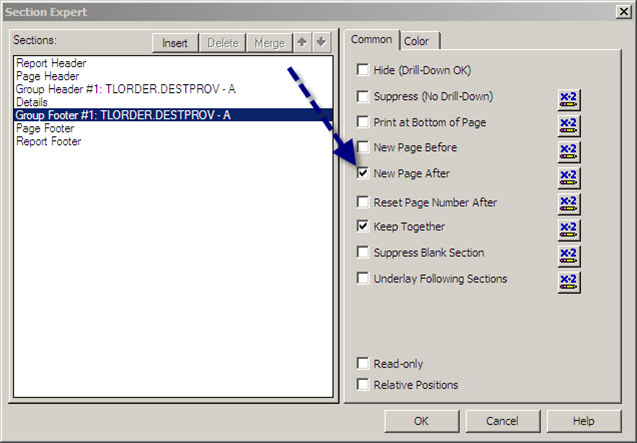
In the menu that appears, select Section Expert.
The Section Expert window opens. -
For the section you selected, select New Page After and click OK.
Parameters
If you add parameters to your report, you can require users to enter criteria that affects report behavior. In the following examples, parameters are used to:
-
Create a summary detail report
-
Create a report that lists records that fall within a specified date range
Summary detail
Suppose we have a report that groups revenue details by state. We want to provide the option to display only the total charges (including regular and accessorial charges) by state.
-
Go to View > Field Explorer.
The Field Explorer window opens. -
Right-click Parameter Fields and select New.
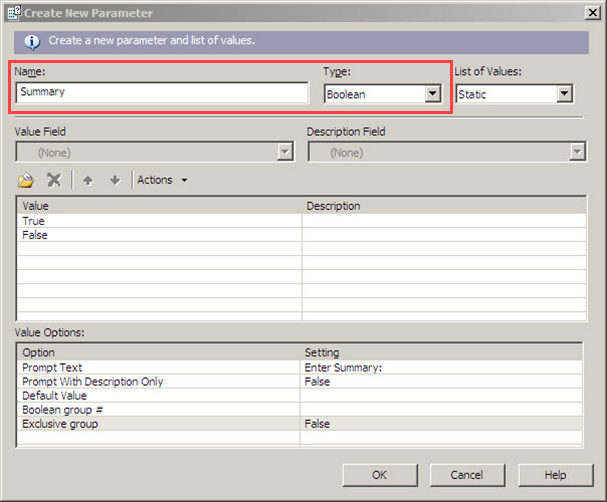
The Create New Parameter window opens. -
Make these field entries:
-
Name: Summary
-
Type: Boolean
-
-
Click OK.
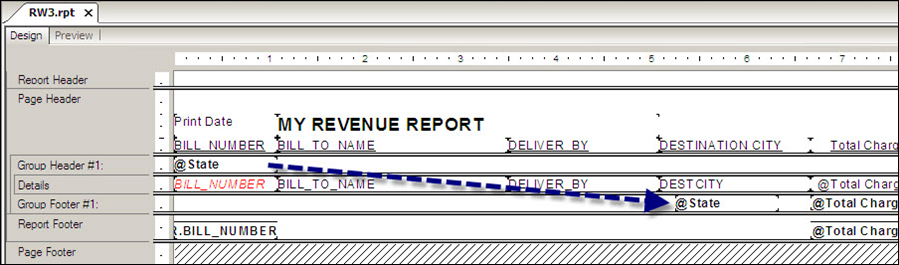
In our sample report, a State formula was created in the first group header. This header will be hidden in the summary report. However, we still want to show this data, so we are moving it to the group footer.
Now, let’s tell Crystal Reports what should happen when our Summary parameter is set to True.
-
Right-click Group Header #1 and select Section Expert.
The Section Expert window opens. -
Click the button next to Suppress (No Drill-Down).
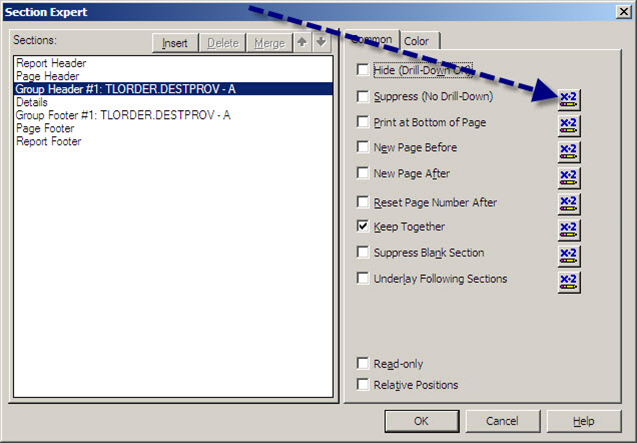
The Format Formula Editor window opens.
-
In the rightmost pane, locate and double-click the Summary parameter. Parameters are prefaced by a question mark.
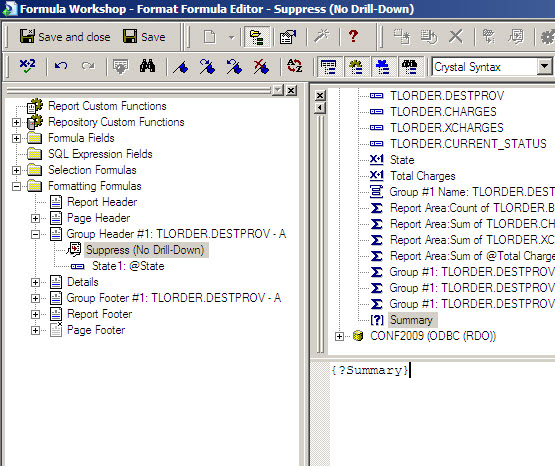
This tells Crystal Reports to show or hide the header based on the value of the parameter.
-
Click Save and Close.
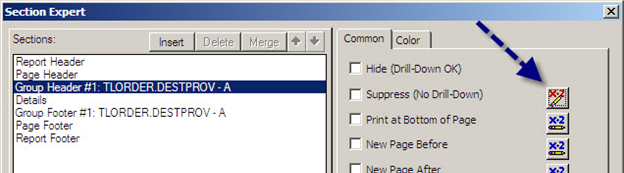
On the Section Expert window, the button next to Suppress (No Drill-Down) is now in red. This indicates that conditional formatting now exists for this option.
-
Click OK to save the changes.
-
For the summary report, we want to hide the contents of the Details pane. To do this, repeat Steps 5-9 for the Details pane.
When we preview this report, we are now prompted to choose whether we want to see the summary version.
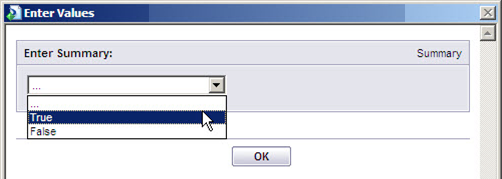
Selecting True should display the summary report.
Date range
Suppose, on this same report, we want to provide the option to show records with a delivery date that falls within a specified date range. To do that, we can create a new parameter.
-
Go to View > Field Explorer.
The Field Explorer window opens. -
Right-click Parameter Fields and select New.
The Create New Parameter window opens. -
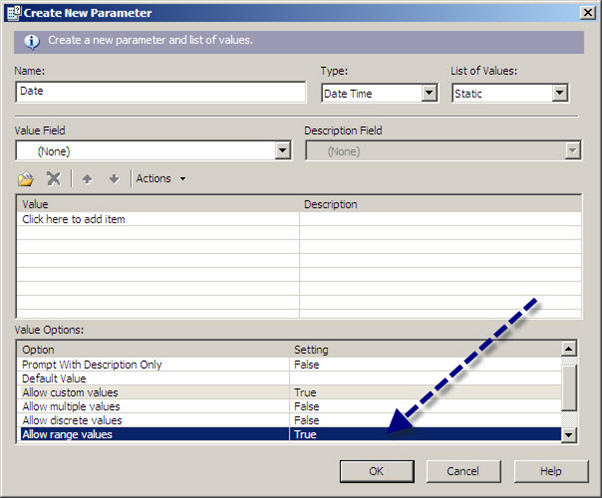
Make these field entries:
-
Name: Date
-
Type: Date Time
-
-
For this parameter, set Allow range values to True.
-
Click OK.
-
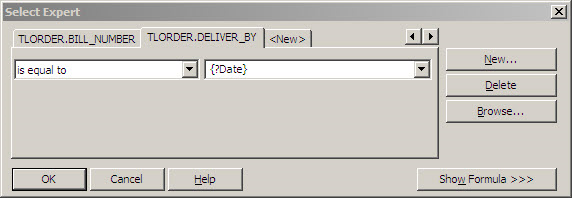
In the report, right-click the DELIVER_BY field and select Select Expert.
The Select Expert window opens. -
For the selected field (TLORDER.DELIVER_BY), select is equal to and the parameter we created (which is prefaced by a question mark).
-
Click OK.
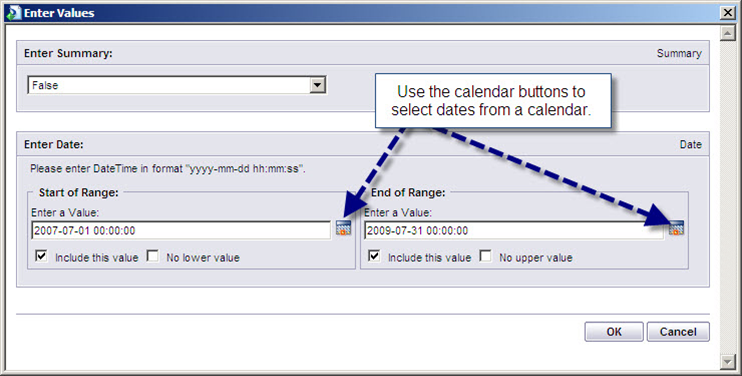
When we preview this report, we now see an additional option that lets us choose a range of dates.
Subreports
You can include a subreport within a report. It lets you display multiple records related to a single record without duplicating records.
In this example, we will add a subreport that shows the trip(s) each freight bill has been on.
-
If necessary, create an empty area in your report in which you will put the subreport.
-
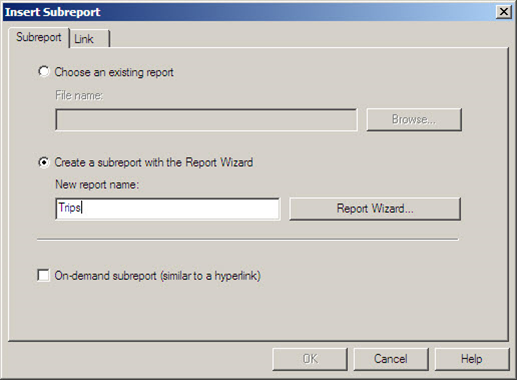
Go to Insert > Subreport.
The Insert Subreport window opens. -
On the Subreport tab, with Create a subreport with the Report Wizard selected, enter a name in the New report name field.
-
Click Report Wizard.
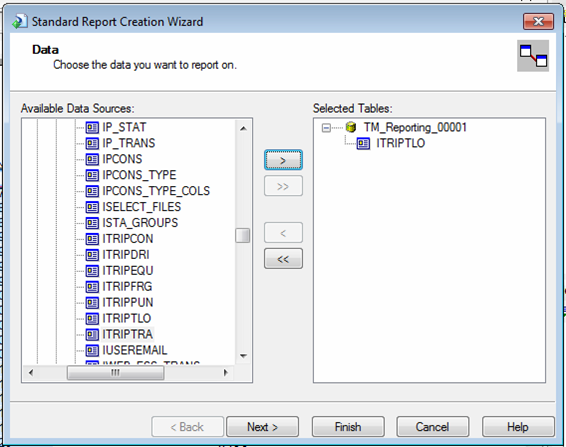
The Standard Report Creation Wizard opens. -
On the Data page, select the data source(s) of the field(s) you want to include in the subreport. In this example, the data will come from the ITRIPTLO table.
-
Click Next.
-
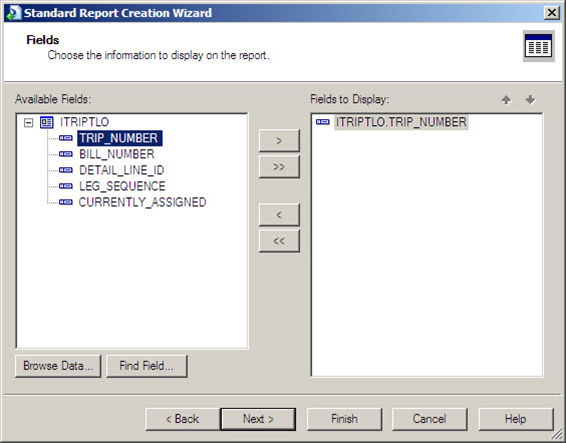
On the Fields page, select the field(s) to include.
-
Click Finish.
-
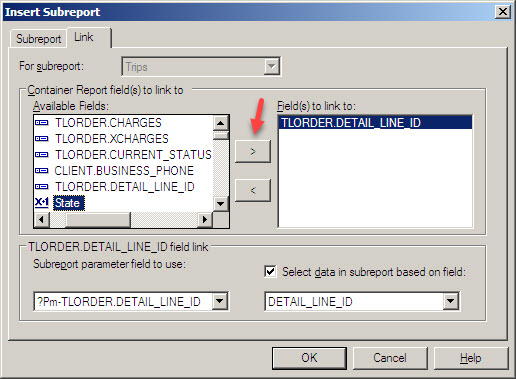
To retrieve the correct data, subreports must be linked to the main report. On the Insert Subreport window, select the Link tab.
-
In the Available Fields list, locate the field to link to and click > to move it to the Field(s) to link to field.
-
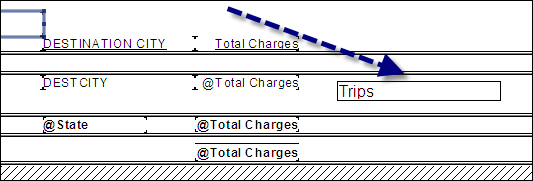
Click OK. You should now see the outline of the subreport at your mouse cursor. Drop it into the empty area you created in step 1.
Preview your report. If you want, you can return to design view and double-click on the subreport to edit fields and section sizes.