Command Center
The Command Center is a powerful management tool that provides fleet executives easy access to real-time performance information. The Command Center provides one central location to measure, analyze and visually display vital information from every area of your Trucking organization.
This program is designed to shift trucking fleets and companies away from traditional information reporting to focusing on Key Performance Indicators (KPIs) that drive revenue and business expansion. By carefully monitoring sales, dispatching and customer behavior you can identify areas of opportunity to generate additional revenue and identify problem areas that may require immediate actions or need to be monitored.
The Command Center launches directly from the desktop, pulling data from daily and historical information entered by operational staff including but not limited to: dispatching, billing, customer service and accounting departments. Managers can easily design customized pages of information, displayed in expandable cells that monitor the company’s unique key performance indicators.
Once installed, the Command Center program comes complete with a standard set of sample pages and KPIs that can be used to create your own pages and customized KPI SQL queries.
To access Command Center:
| From this location | Go to |
|---|---|
TruckMate Menu and TruckMate Task List |
|
Windows Start Menu |
TruckMate 20xx > Command Center |
Windows Explorer |
C:\Program Files (x86) > TruckMate 20xx > KPI.exe |
Context menu |
You can access Command Center from a number of TruckMate programs by right-clicking on certain tables and selecting Call Command Center. You set up this feature in Codes Maintenance. |
Layout
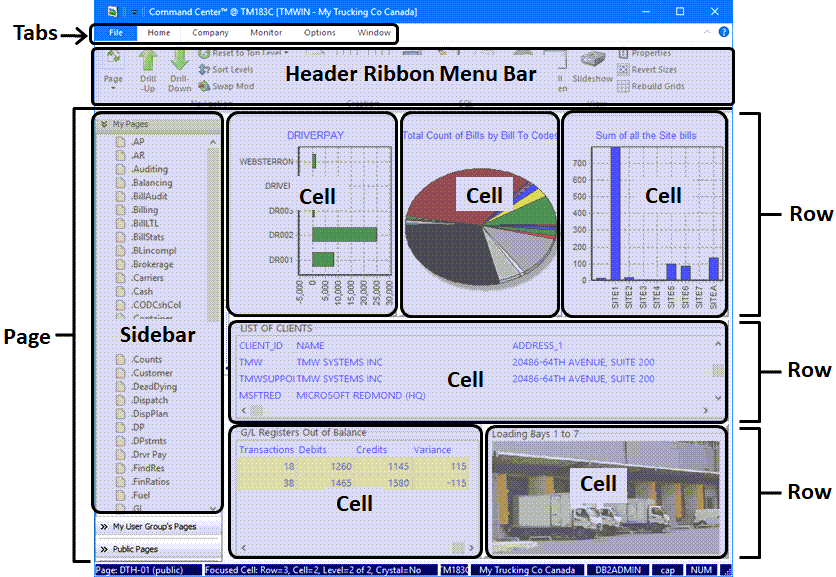
Your Command Center page will look different from this image since pages are typically modified to suit your needs.
A page contains one or more rows. Each row can contain one or more cells. Each cell can display a variety of content types including KPI information presented in charts and grids.
Each cell can also contain several levels (layers) like a stack of cards.
Every TruckMate user can have the ability to create his/her own set of Command Center Pages & KPIs (Key Performance Indicators). You may create an unlimited number of pages. Each page may be split into a maximum of 10 rows and each row may be split into a maximum of 10 cells. Each cell may be set up to be refreshed at different intervals (in minutes).
When combined with grid customizations to highlight specific data conditions or alerts together with your own custom SQL queries, the Command Center is an even more powerful and useful tool.
What’s New in Command Center
Prompt for parameter value when executing a stored procedure in Command Center (TM 2021.1)
A new Enter Parameter Values form was added to the Command Center program in TM 2021.1 to pass parameters to a stored procedure.
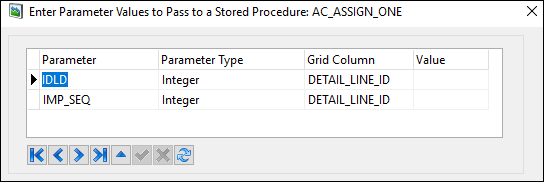
You will be prompted to enter a missing grid parameter value required to execute a stored procedure. A new Prompt for Parameter Value field needs to to be set to True in the Stored Procedure Setup form since it will be set to False by default.
Setting up Command Center
Setting up Application Configurator for Command Center
The following Application Configurator options are listed under Configuration Options > KPI.EXE.
| Option | Definition | Values |
|---|---|---|
Global Cell Refresh Limit |
Set the minimum global cell refresh time in minutes. A value of 0 allows you to set up KPIs with different auto-refresh time interval for individual cells. If the value is set to a non-zero, then the user is required to set the cell’s refresh rate to at least the configuration value or higher. |
Must be a whole number greater than or equal to zero. Default is 0. |
Minimize Application to Task Bar |
Determines if application minimizes to task bar or notification tray. |
|
TMW Upload Site |
Specifies the location of the TMW Systems website for use in uploading KPI data. |
Future enhancement |
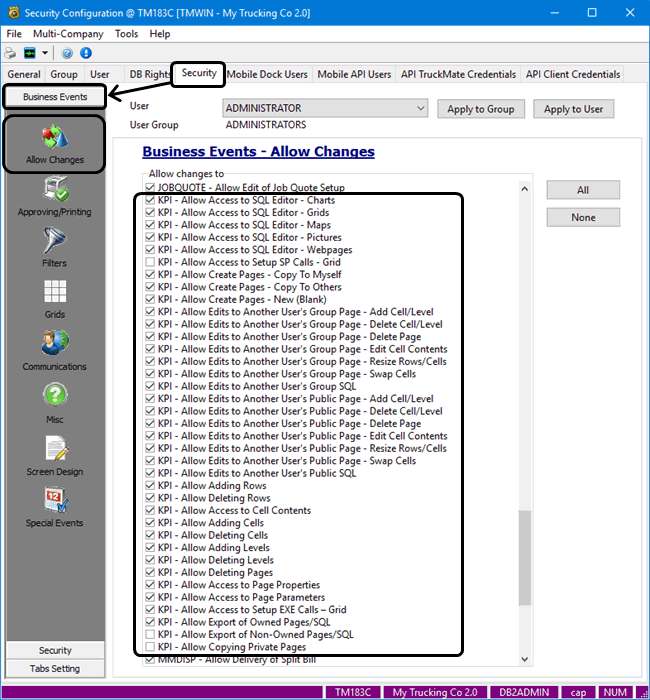
Setting up Security Configuration for Command Center
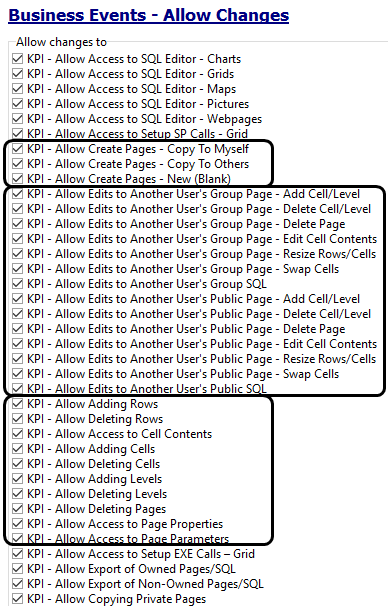
The following options are available in the Security > Business Events > Allow Changes section of Security Configuration. These options allow the TruckMate system administrator to control which users have specific editing capabilities when it comes to creating and editing the page layouts and the cell contents displayed on the Command Center pages.
|
Configuring the Command Center
Configuring the Command Center is a process of deciding which of the default pages that already come with the TruckMate system are ready to use out of the box, tweaking existing pages or creating your own and ensuring the appropriate security permissions have been assigned to control who can access or edit the pages.
The Command Center program comes with a standard set of sample pages and KPIs that can be used to create your own pages and customized KPI SQL queries. (The sample pages & KPIs will use your actual data, not sample data.)
|
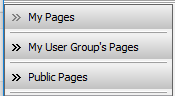
Sidebar - Organizing Pages
The sidebar contains a list of links allowing you to display the KPI pages.
There are three subsection groups available in the sidebar:
-
My Pages
-
My User Group’s Pages
-
Public Pages
Double-click to open any of the pages available in the three subsections.
| If you create a page and make it public, it will appear in My Pages and in the Public Pages sections. Different users may each create a page with the same name. |
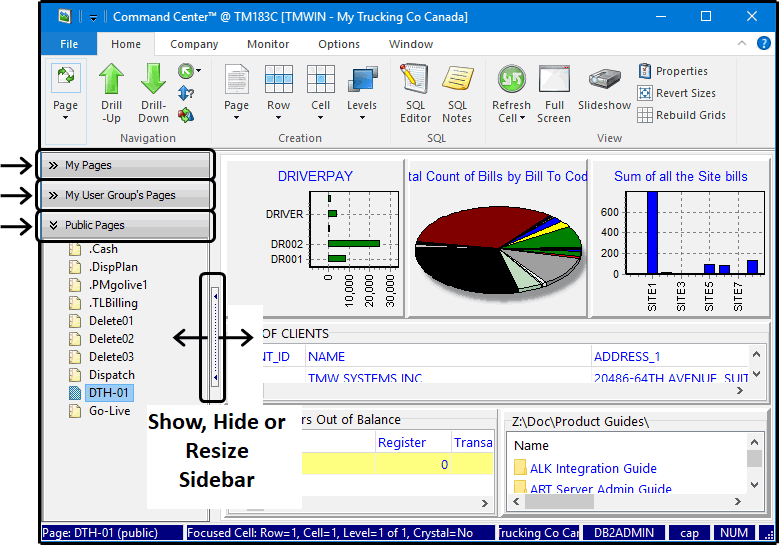
Click the middle slider icon to show and hide the sidebar or drag it sideways to resize the sidebar width.
Organizing page links in the sidebar
Right-click one of the pages from the My Pages section in the Sidebar to display the shortcut menu. Use these functions to organize the page links to make finding and switching between them easier. This shortcut menu is only available within the My Pages section.
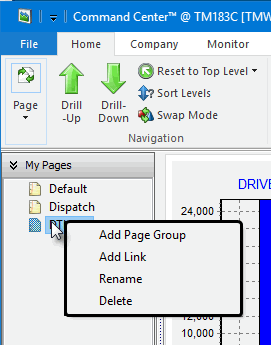
| All the functions in this shortcut menu only apply to the links and the group folders, not the pages. For example, when you rename or group a link you are not renaming or deleting the associated page. You are only changing the link. |
Add Page Group |
Creates a page group folder. Name cannot be the same as any existing folder and a maximum of 10 characters. The folder node will be added to the tree and your selected page will be in that folder. Drag and drop pages into page group folders to create your own folder tree structure. Page group folders can be nested within other folders and can be dragged and dropped from one location to another. Note: When you delete a page group folder, it will also delete all the links within it (but not the actual pages). |
Add Link |
Creates a link to an associated underlying page. If you create multiple links for the same page, remember that any changes to the underlying page will affect all the other links since they all point to the same page. |
Rename |
Renames the page name link as it appears in the sidebar. (It does not rename the actual page since this is edited using the Page Properties window.) |
Delete |
Deletes the selected page group folder or page link. When you delete a page group folder, it will also delete all the links within it (but not the actual pages). Use the Add Link function to restore any page links if they were accidentally deleted. |
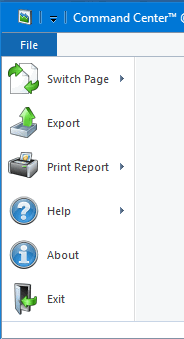
File tab
The File tab contains commands used to export KPI queries as SQL statement text files, print reports and the typical file menu items. It also contains Switch Page functions identical to the Switch Page functions described as part of the Home tab.
Exporting a page
Selecting the Export button will open the Export to File window, which allows you to export your KPI pages and/or SQL queries for distribution to other users. These exports allow you to include properties like the grid settings and formatting, etc., which allow the person on the receiving end to see how the KPI page/SQL was designed.
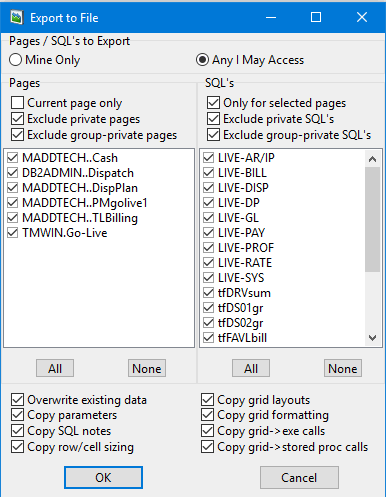
The Pages section displays all of your current KPI Pages (if Mine Only is chosen above), or all of the KPI Pages available to you (if Any I May Access is chosen). Select the checkbox next to the Page name in order to include it in the export file.
|
The ability to export pages requires specific permissions available in the Security > Business Events > Allow Changes section of Security Configuration.
|
The SQL’s section displays the SQL queries used by the KPI pages available in the Command Center program. You can then check the box next to the SQL query name in order to include it in the export file, which is helpful for anyone importing the KPI page.
In addition to exporting KPI Pages and/or SQL queries, you can also export any combination of the following KPI-specific data.
Overwrite Existing Data: if selected, a "DELETE…" statement will be added (to the export SQL text file) before each "INSERT…" statement.
If the database you are exporting to does not have any Command Center data installed, it does not matter whether or not you check this option (both the export and later import will be marginally faster if you un-check it).
However, if the database you plan to import to does have Command Center data, it will make a difference. Un-check it if you only want to insert "new" data (pages, sql’s, etc.)- the INSERT statement will fail for any data object with the same name as an existing object in the database being imported to. Check this flag if you wish to overwrite any existing data (i.e. updating some KPIs installed previously).
| The Export option will create a SQL file in a hard drive location as specified, which can then be easily imported into the Command Center program by another user. |
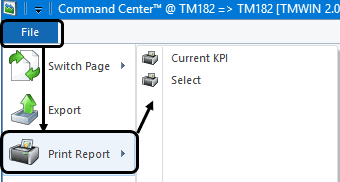
Printing a report
In the Command Center, you will have the option to select and print any report or to print a report based on the current KPI.
Go to the File menu and click Print Report > Select to display the standard Report Selection window that allows you to print any report.
Printing the report associated with the selected cell
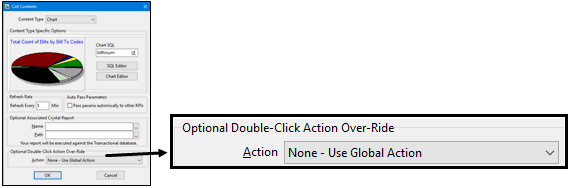
Every KPI cell can be associated with a specific Crystal report using the Optional Associated Crystal Report settings on the Cell Contents window. When you use the File > Print Report > Current KPI command, it will print the report associated with the currently selected cell.
You can also set the cell content’s Optional Double-Click Action Over-Ride > Crystal setting so that double-clicking the cell will immediately bring up the associated Crystal report.
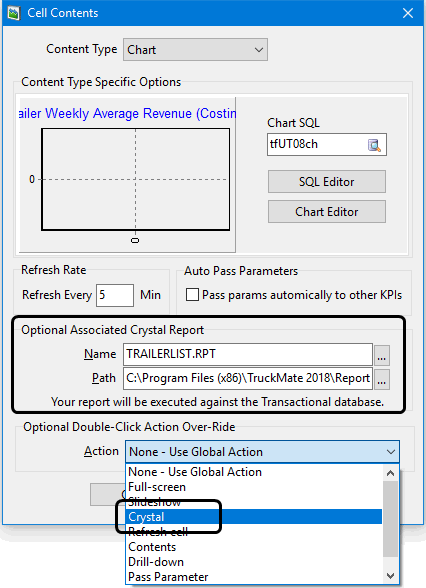
You may optionally associate a Crystal Report with each cell. This option will launch the associated Crystal report in a separate window. You can quickly see if there is a Crystal Report associated with the currently selected cell by looking at the status bar at the bottom of the screen. If Crystal = Yes, there is a report available for these cell contents. See the Cell Contents section for more details on how to associate a Crystal Report with a cell.
Printing a report with the current KPI (Crystal Report Automation)
The Command Center program can pass KPI parameters to a Crystal Reports generated from the application, a measure that both saves time and ensure data accuracy. If you call the Crystal Report that is associated with the currently selected cell and that Report contains a parameter with the same Name and Type as a KPI parameter on the current KPI page, then the value of the KPI parameter will be passed to the Report and you will not be prompted to enter it. You will still be prompted for any Crystal parameters that do not match those of the KPI parameter.
|
The name comparison between the KPI cell and the Crystal Report is NOT case-sensitive: all KPI parameters are saved in uppercase (and the Crystal parameters will be converted to uppercase (for the comparison only). In addition, you may enter KPI parameters names up to 40 characters in length long (previously, the maximum was 10). Crystal Reports allow parameter names up to 255 characters, but such long names would not display properly at the top of a KPI cell. Therefore, if your report has parameter names longer than 40 characters, and you want to automatically populate them from KPI parameters, you have two choices:
|
Parameter Formatting Tips…
-
You may use spaces in KPI parameter names- just enclose the parameter name in double quotes (i.e. 'CLIENT.NAME' = "Client Name").
-
For a Boolean type parameter, False will be passed to Crystal by default (i.e. if the assigned parameter value is anything but True [case-insensitive]).
-
For a DateTime or Date or Time type Crystal parameter, use a DateTime parameter in Command Center (in the middle Type column on the Parameters window, choose DateTime and then double-click the Value column so you populate the value using the format of
2009-01-31 00:00:00).
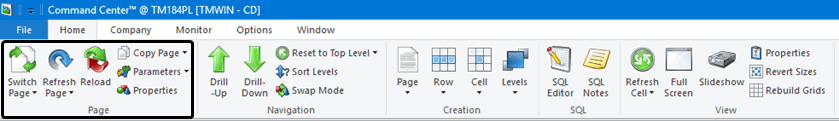
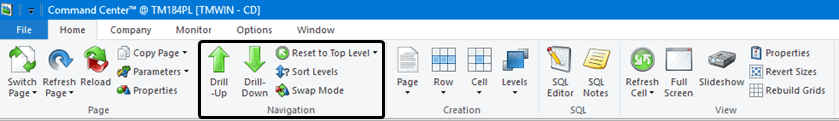
Home tab
Some of the functions displayed on the Home tab are arranged differently depending on the width of the window. Some of the functions in the Page and Navigation section are compressed to display only their icons.
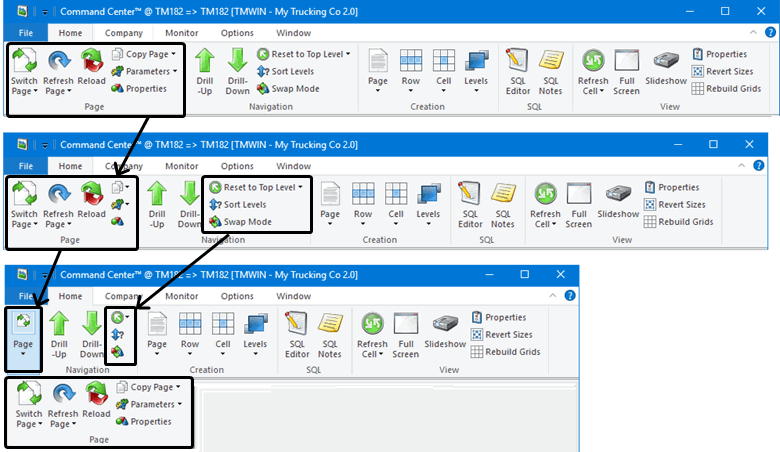
Page section
Switching pages
Use the sidebar to switch pages by selecting any of the pages listed in the three sections:
The name of the current page is displayed in the bottom left corner of the status bar.
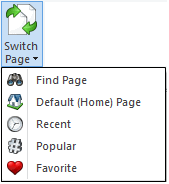
The Switch Page button on the left of the Home page header ribbon menu bar provides additional features such as adding pages to your favorites list and designating a default page to make it faster and easier to find the pages you use most often.
Refreshing a page
Click the top part of the Home tab > Refresh Page button to force ALL cells on the current page to Refresh, displaying any new KPI data.
![]()
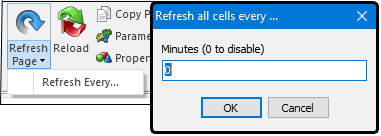
Clicking the Refresh Page pick list Refresh Every option opens a dialog window where you can supply the number of minutes that must elapse before all cells on the current Command Center page will automatically refresh. Entering 0 (zero) will disable automatic refreshing functionality.
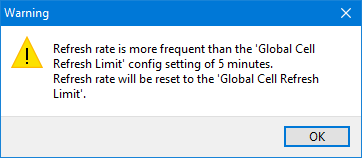
If the value for the page refresh is less than the Global Cell Refresh Limit configured within the Application Configurator program, a warning message will be displayed and the refresh page value will be reset to match the Global Cell Refresh Limit value.
A Global Cell Refresh Limit of 0 allows you to set up KPI pages with different auto-refresh time interval for individual cells.
If the cells within a page are set to different refresh times regardless of whether these times are smaller or larger than the page refresh interval, the page refresh will be automatically set to 0. Conversely, if the cells within a page are set to different refresh times and you edit the page refresh time, all the cells on that page will automatically have their cell refresh time set to match the page refresh time.
Reloading a page
![]()
This option is similar to a refresh, however, instead of just refreshing the contents, it will clear the entire page and re-read/re-create all the cell contents (just as though you had switched to a different page and back). This feature is especially useful if you are changing data via the SQL Execute program while you have the Command Center open.
Copying a page (Save As)
You can make a copy of a page for your own use or you can copy the page to other users.
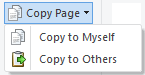
Selecting the Home tab > Copy Page > Copy to Myself option opens the Copy A Page window, which allows you to setup the copying options. You can define the source user / page, the destination user / page and a selection of what components will be copied of the selected page.
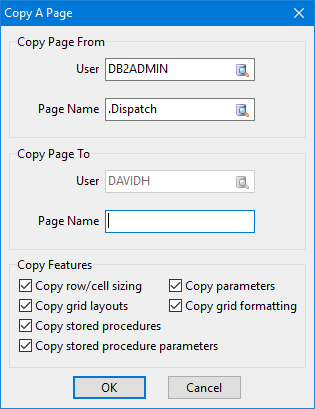
|
The ability to copy pages requires a specific permission available in the Security > Business Events > Allow Changes section of Security Configuration.
|
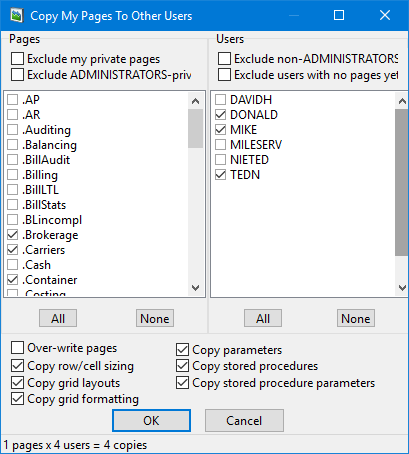
Copying my pages to other users
Selecting the Home tab > Copy Page > Copy to Others option will open the Copy My Pages to Other Users window, which allows you to copy one, two or all of your KPI pages listed on the right side of the window to any number of other Users shown on the left. You may not copy a page to any other user if the page contains a chart, grid, or map with a SQL that you have flagged as private. Similarly, you may not copy a page to a user outside of your user group if the page contains a chart, grid, or map with a SQL that is flagged as "share with my group".
Use the filter checkboxes at the top of the window to control the grid contents and use the checkboxes on the bottom of the window to control which page characteristics should be included in the copy.
Copying Private Pages
This security permission controls whether users with only private pages show up in the User edit pick or whether private pages show up in the Page Name edit pick in the Copy Page From section on the Copy A Page form in the Command Center program > Copy Page > Copy to Myself function.
|
The ability to copy private pages requires a specific permission available in the Security > Business Events > Allow Changes section of Security Configuration. KPI - Allow Copying Private Pages |
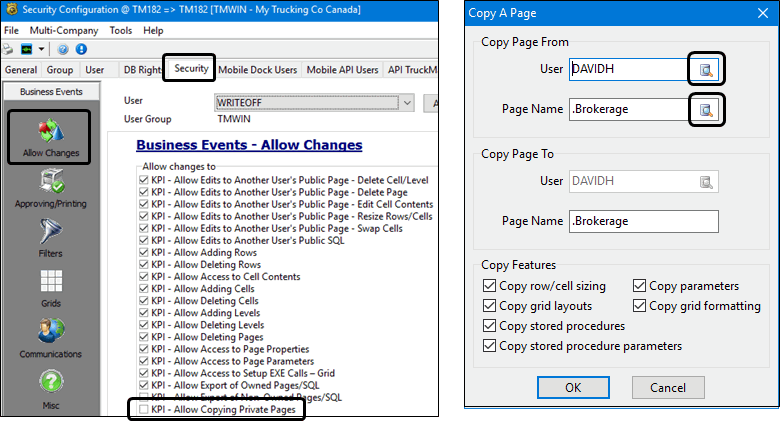
The User and Page Name edit-pick controls in the Copy Page From section are updated to take into account the private status of the various KPI pages in the system:
-
User: If a particular user has only private KPI pages under their username, that user will not display as an option in the results of the User edit-pick.
-
Page Name: Only pages that set as Public (or My Group and the logged in user is of the same group) will show as options in the results for the Page Name edit-pick.
| the Copy Page To section is not altered, and will still allow access to private pages. This allows a user to copy their own private page to another user, if they so desire. |
Setting Parameters
If any of the page grids require parameters, they can be edited and assigned to a page.
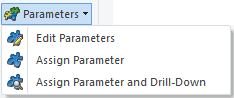
The Home tab > Parameters > Edit Parameters option will bring up the SQL Statement Parameters window, listing all the parameters for all of the cells on the current page.
If the same parameter name is used by multiple KPIs, a change to the parameter will be reflected in all the affected KPI cells. (For example, change year from 2018 to 2019.)
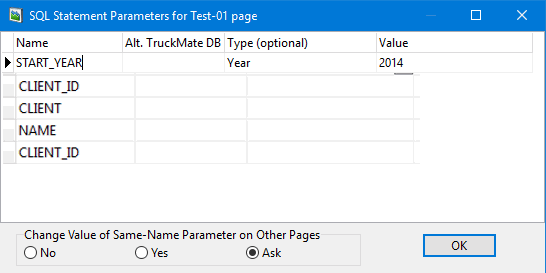
When entering the parameter value for a date or timestamp value, you can use the '<Ctrl><D>' hot key combination (or a mouse double-click) to bring up a pop-up calendar so that you can enter the value in the correct format.
| In this screen, for speedier data entry, you can use the enter key (no down arrows or mouse-clicks required). By pressing the enter key, it will navigate you to the next parameter in the list or to the "r;OK" button if you are on the last parameter. The default format from the pop-up is for a timestamp (i.e. 2004-11-01 6:00:00). This is good when your KPI contains something like 'WHERE CREATED_TIME >= :D'. If you want to use a date-only parameter, (i.e. 'WHERE DATE(CREATED_TIME) >= :D') then strip off the time portion. |
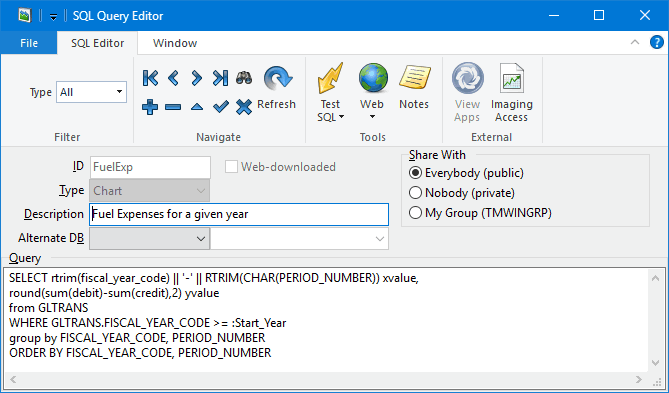
The syntax required is to prefix your parameter with a colon. For example, if you wanted to chart the Fuel Expenses for a given fiscal year (where you can specify/change the fiscal year) the SQL query would look something like this with the parameter being Start_Year.
SELECT rtrim(fiscal_year_code) || '-' ||
RTRIM(CHAR(PERIOD_NUMBER))xvalue,
round(SUM(DEBIT)-SUM(CREDIT),2) yvalue
FROM GLTRANS
WHERE GLTRANS.FISCAL_YEAR_CODE >= *:Start_Year*
GROUP BY FISCAL_YEAR_CODE, PERIOD_NUMBER
ORDER BY FISCAL_YEAR_CODE, PERIOD_NUMBER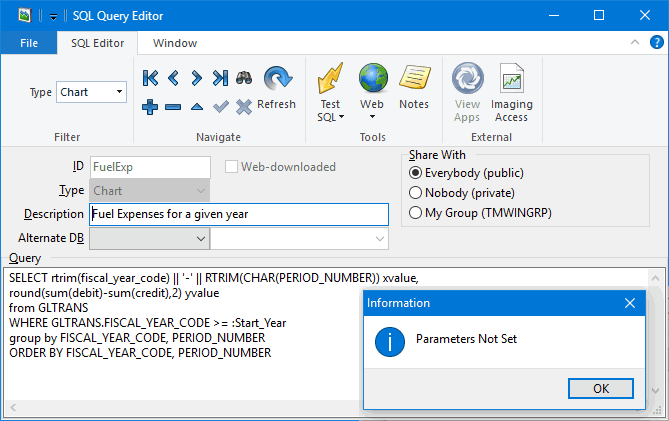
| When you post the SQL query containing parameter references for the first time, a "Parameters Not Set" warning message will be displayed to remind you to use the Home tab > Parameters > Edit Parameters option and enter a value for the new parameter. |
Editing the Page Properties
-
Open the Command Center program (KPI.EXE).
-
Switch to the page you would like to edit.
-
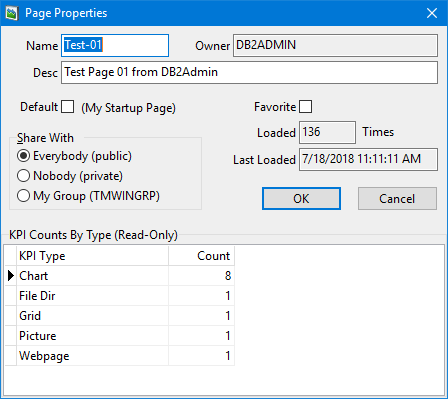
Click Home tab > Properties to open the Page Properties window.
-
Change the name, description and other properties for this page.
Note: You cannot change the page owner and you cannot uncheck the page default flag; rather, switch to the page you want to make default, go to the page properties screen, and select the default flag.
Setting the Default Page
-
Open the Command Center program (KPI.EXE).
-
Switch to the page you would like to set as the Default.
-
From the Home tab, click Properties to open the Page Properties window.
-
Select the Default (My Startup Page) checkbox.
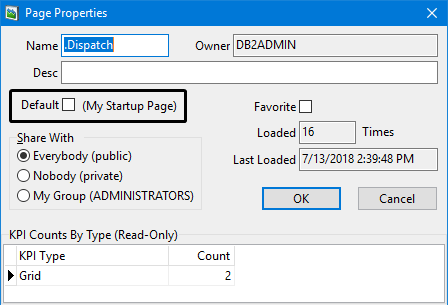
Note: Once selected, the Default (My Startup Page) checkbox cannot be cleared. Switch to the page you want to set as the new default, bring up the page properties screen, and select the default flag.
Sharing a Page
Sharing a page is not the same as copying a page. To share a page with other users:
-
Open the Command Center program (KPI.EXE).
-
Switch to the page you would like to share.
-
From the Home tab, click Properties to open the Page Properties window.
-
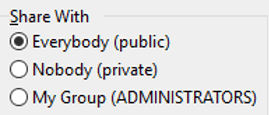
In the Share With section, indicate whether to share with everyone or just the members of your security group.
-
Look at the status bar (bottom left corner) to confirm this new sharing status.
Additional Notes about Sharing
Sharing the current page with Everybody (public), will allow anyone who uses the Command Center program to copy your page via the Copy a page from another user option.
| If you make a page public, other users can modify it. If you want to disallow others from making changes to your page, consider making a copy (Page > Copy > To Myself) and then making the copy public. Or, if you want to give a page to another user(s) without making it public, use the copy feature (Page > Copy > To Others). Similarly, if you want to make (private) changes to a public page, consider making a copy of the page first (Page > New > From Another User). |
If a public page contains KPIs with SQL parameters, then each user has their own list of parameter values. In other words, 1) each user must initialize the parameters the first time they view the page, and 2) if user A changes the parameter values, the changes do not affect user B.
The second option is to share the current page with Nobody (private), meaning that the program will prevent anyone else (except supervisors) from taking a copy of the page via the Copy a page from another user option. However, you may still copy the page for your own use and rename it via the Copy this page option. You may not make a page private if you are not the page’s owner.
The third option is to share the current page with My Group (ADMINISTRATORS), which will allow you to restrict access similar to Private, except that anybody from your Security Group (and supervisors) may copy this page.
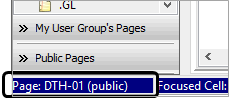
The status bar at the bottom/left of each page will indicate whether the page is Private, Public or belongs to a Group.
| You will not be allowed to set the page to public if any charts or grids are based on private or group KPIs. If a User Group is flagged as having Supervisor rights in Security Configuration, they will then have access to all KPIs, regardless of the Share With setting. |
Adding a page to your favorites
When you use the Switch Page features in the Command Center, there is an option to select a page from your list of favorites. To designate a page as a favorite:
-
Switch to the page you would like to include in your Favorite list.
-
From the Home tab, click Properties to open the Page Properties window.
-
Select the Favorite checkbox.
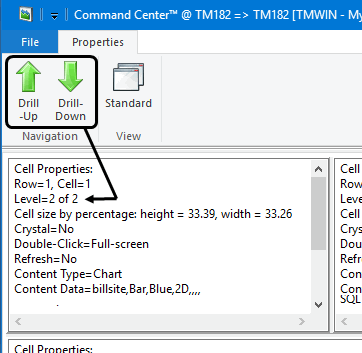
Navigation section
Using Drill-Up and Drill-Down to view other levels
A cell can contain many levels, each displaying their own set of KPI contents. To view the other levels in a cell:
-
Select the cell.
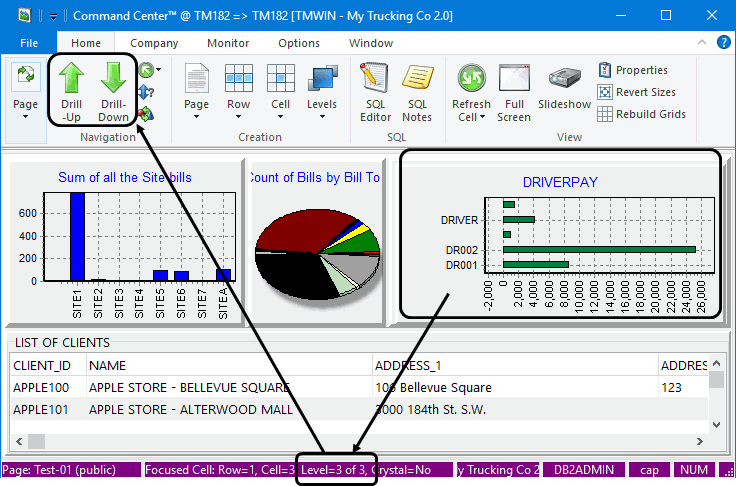
-
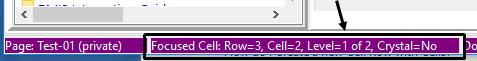
Notice the number of levels displayed in the status bar at the bottom of the Command Center window (e.g. Level 3 of 3)
-
Click the Drill-Up or Drill-Down buttons to navigate from one level to another.
If the selected cell only has one level, a dialog box will be displayed.
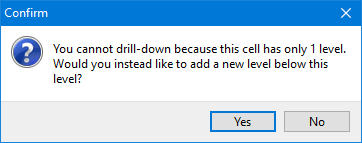
-
Click No if you do not want to add additional levels or change anything.
-
If you click Yes, Command Center will create and display an empty new level in the cell. You will need to click the Home tab > Cell button > Contents option to set up some KPI information to be displayed in this new level.
Note: If you created a new level accidentally, you can use the Home tab > Levels > Delete Level command. (Be sure not to accidentally delete the cell instead of just the level or you will erase the cell and its already existing contents. There is no undo function.)
-
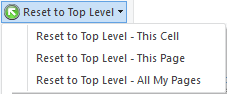
Resetting to the top level
If you are working with Command Center pages where many of the cells have many levels, you may want to reset the cell or the whole page back to its original state with the top-level KPIs appearing in the cell(s).
Click the Home tab > Reset to Top Level function to display a list of option which allow you to reset just the cell you are working with, every cell on the page or every cell on every page.
Sorting levels
If a cell has been associated with many levels, you can control the order in which the levels are displayed.
-
Click the Home tab > Sort Levels function to display the Order Levels For Page window with a list of each level associated with this cell.

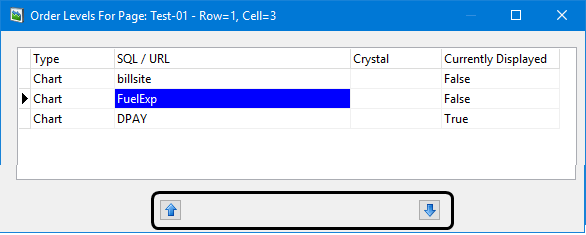
-
Select the level and use the up / down arrow buttons to change the sort order.
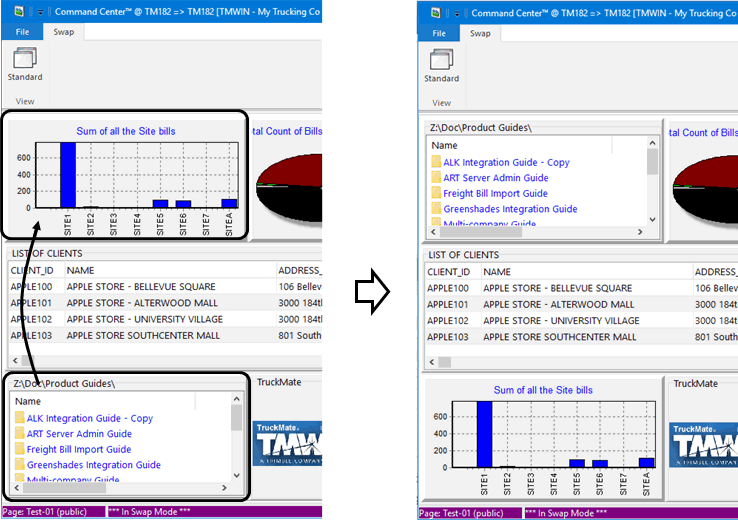
Using Swap Mode to rearrange the page layout
Swap mode allows you to drag and drop cells from one part of the page to another.
-
Open the Command Center program (KPI.EXE).
-
Click the Home tab > Swap Mode button.

A confirmation message box is displayed.
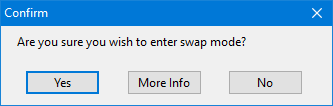
-
Click Yes.
The page is refreshed and enters swap mode. Entries at the top and right corners of the window will indicate when you are in Swap Mode.
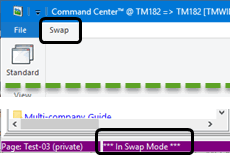
-
Use your mouse to drag and drop to move a cell to a new location. For some cell contents like webpages and maps, you may need to drag it by the title bar to avoid interacting with the data.
The screen refreshes to show the changes.
-
Click the Standard button to exit Swap Mode and return to the regular Command Center window.
| Most of the functions are disabled while in swap mode so be sure to exit swap mode when you are finished by using the Standard button. |
Creation section
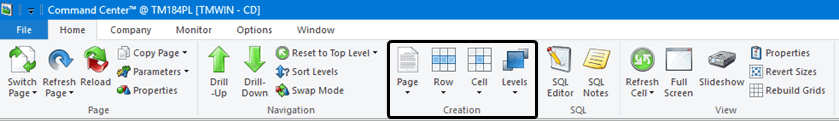
Creating a New Command Center Page
-
Open the Command Center program (KPI.EXE).
-
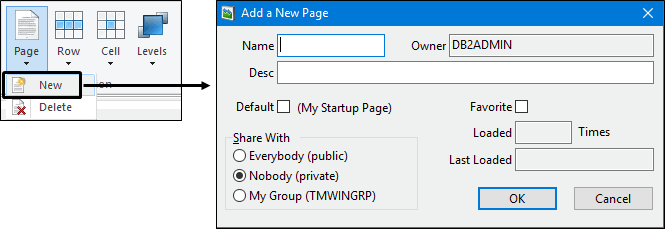
From the Home tab, click the Page button > New option to open the Add a New Page window.
-
Name your new page (maximum of 10 characters with no &), add a description and click OK.
A new blank page containing a row, a single level and an empty blank cell will be displayed. You can add additional rows, cells, cell contents and levels.
When a new page is first created, a link will also be created in the My Pages section of the sidebar. If the link is somehow accidentally deleted, use the Add Link option from the shortcut menu for the sidebar to restore it.
Deleting a Command Center Page
-
Open the Command Center program (KPI.EXE).
-
From the Home tab, click the Page button > Delete option.
Note: You cannot delete a page that is currently displayed or the page designated as the Default page (the page that loads when you start the Command Center program). If you want to delete the currently displayed page, switch to another page first.
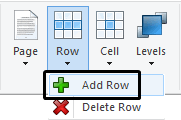
Adding a new row in Command Center
-
Open the Command Center program (KPI.EXE).
-
From the Home tab, click the Row button > Add Row option.
-
A new empty row is added to the page. The spacing for each row is automatically adjusted to be shared evenly by the rows. A page can have several rows. Rows are used to display cells.
Adding a cell to a row in Command Center
-
Click to select the desired row where the new cell will be displayed.
-
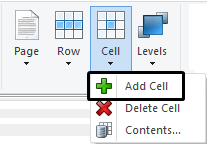
From the Home tab, click the Cell button > Add Cell option.
-
A new empty cell is added to the row. The spacing for each cell is automatically adjusted to be shared evenly. A row can contain several cells. Cells are used to display information as the contents.
Note: The ability to create, edit and delete pages and page elements requires specific permissions available in the Security > Business Events > Allow Changes section of Security Configuration.
Adding contents to a cell
-
Select the desired cell where the contents will be displayed.
-
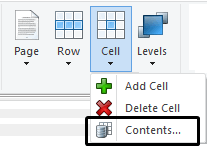
From the Home tab, click the Cell button > Contents option.
-
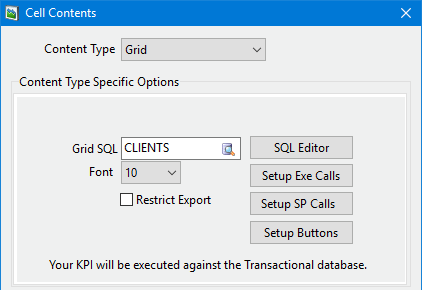
The Cell Contents window is displayed.
-
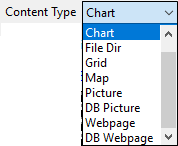
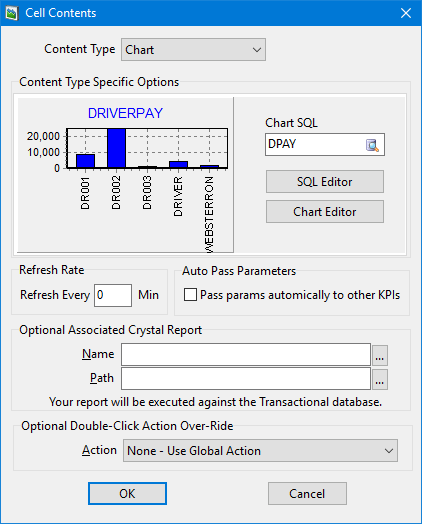
Select the desired type of information to display within this cell using the Content Type drop-down list. Each of the content types will have their own unique set of parameters and configuration settings.
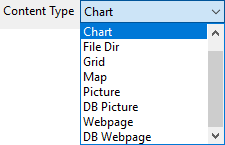
For example, if you select a chart, you will need to select a Chart SQL statement (i.e. the KPI) to supply the data. Use the SQL Editor button to customize the underlying SQL query statements and the Chart Editor button to change the style series (e.g. bar chart, pie chart, stacked bar chart, etc.) and the appearance of the chart(e.g. color, font, size, etc.). It is possible to create and save your own SQL statements as KPIs using the SQL Editor.
You can also adjust other settings related to the cell contents such as refreshing the data and automatically passing parameters.
-
Click OK to save your changes. The page will refresh itself automatically.
There are a variety of different content types reflecting the kind of data you want to represent and how you would like to display. There are also other specialized tools for accessing and displaying additional data details.
Creating and modifying a Chart
-
Switch to the desired page and select the cell. (Create a new level if necessary.)
-
Look at the Status bar at the bottom of the window to verify you are working on the correct cell location.
-
On the Home tab, click Cell > Contents.
The Cell Contents window is displayed.
-
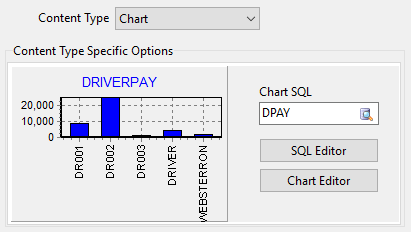
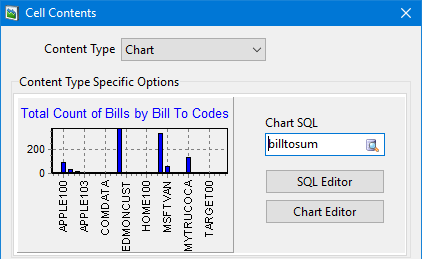
Set the Content Type to Chart.
-
The top half of the Cell Contents window displays options specific to this content type.
-
Click the
 Chart SQL search icon to select the SQL query.
 -
Click the SQL Editor button.
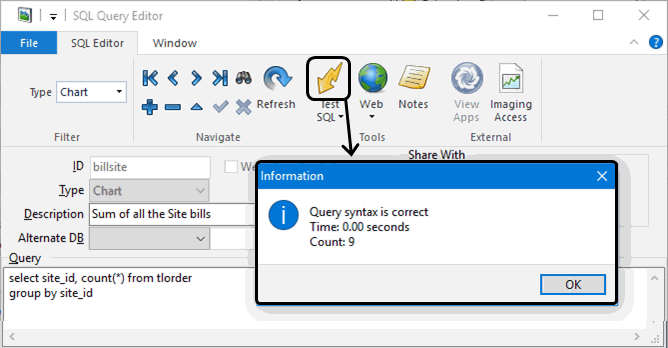
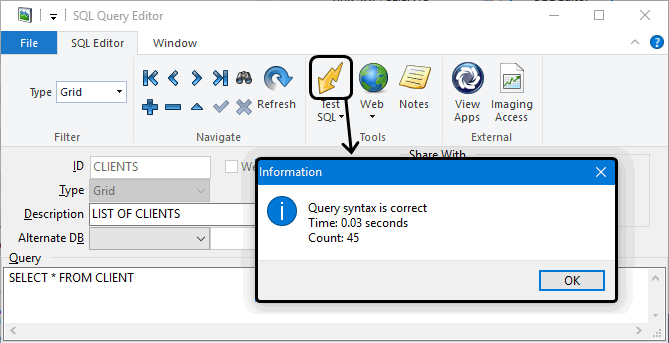
The SQL Query Editor window is displayed.
-
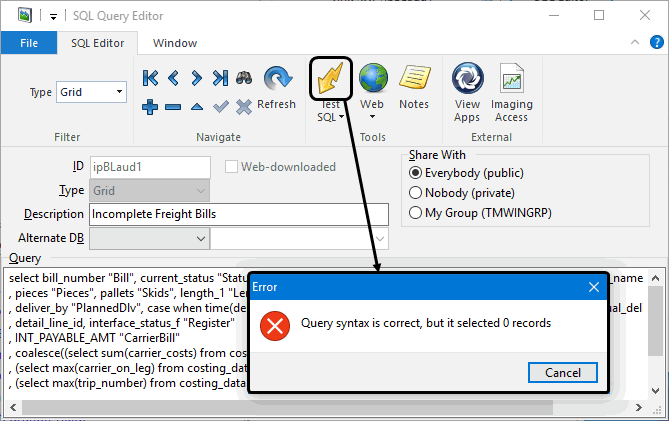
Click the Test SQL button and check the syntax, time and count value to verify the SQL is returning some data in an acceptable amount of time.
If necessary, use the SQL Query Editor to modify the SQL query or to create your own.
-
Click OK and close the SQL Query Editor to return to the Cell Contents window.
-
Click the Chart Editor button.
The Chart Editor window is displayed.
-
Select Series from the list on the left, select the chart series and click the Change button.
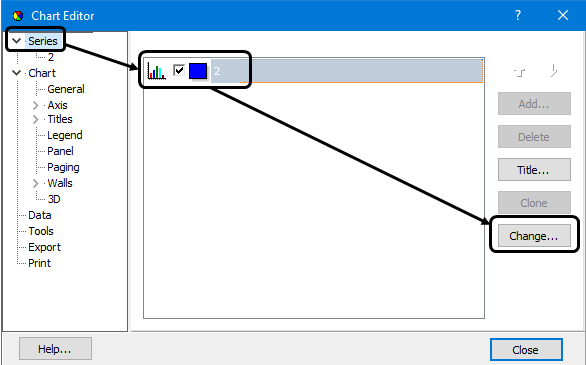
The Gallery window is displayed.
-
Click the desired chart series style.
Note: Use the other chart editor options to customize the chart appearance. Note also that pie charts do not display legend text.
-
To select a more specific style, click the
 picker drop-down icon displayed in the lower left.
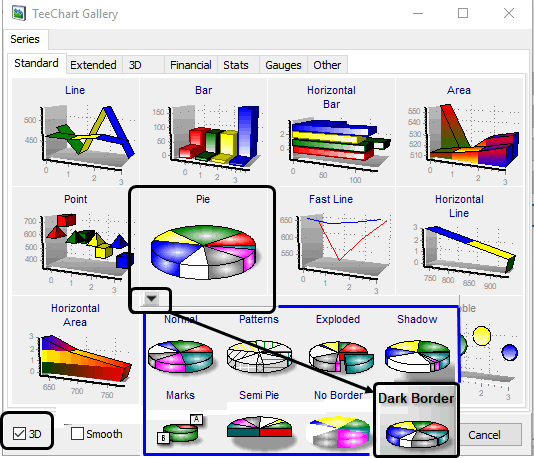
-
Select the 3D or Smooth checkbox to see other appearance options.
-
Click OK button to return to the Chart Editor window.
-
Click Close to return to the Cell contents window.
-
Click OK to save your changes and return to the Command Center window.
The Command Center window will reload the page automatically.
-
Verify the cell is displaying the chart and make any necessary modifications using the Cell > Cell Contents function to re-open the Cell Contents window.
Creating and modifying a File Directory
-
Switch to the desired page and select the cell. (Create a new level if necessary.)
-
Look at the Status bar at the bottom of the window to verify you are working on the correct cell location.
-
On the Home tab, click Cell > Contents.
The Cell Contents window is displayed.
-
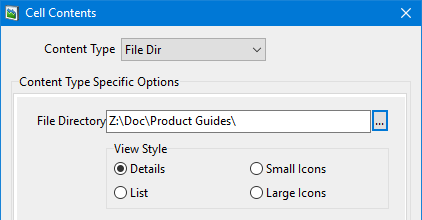
Set the Content Type to File Dir.
-
The top half of the Cell Contents window displays options specific to this content type.
-
Click the
 Browse icon to select the file directory.
 -
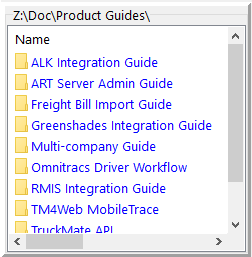
Use the View Style radio buttons to indicate the appearance.
-
Click OK to save your changes and return to the Command Center window.
The Command Center window will reload the page automatically.
-
Verify the cell is displaying the file directory and make any necessary modifications using the Cell > Cell Contents function to re-open the Cell Contents window.
Creating and modifying a Grid
-
Switch to the desired page and select the cell. (Create a new level if necessary.)
-
Look at the Status bar at the bottom of the window to verify you are working on the correct cell location.
-
On the Home tab, click Cell > Contents.
The Cell Contents window is displayed.
-
Set the Content Type to Grid.
-
The top half of the Cell Contents window displays options specific to this content type.
-
Click the
Chart SQL search icon to select the SQL query. -
Click the SQL Editor button.
The SQL Query Editor window is displayed.
-
Click the Test SQL button and check the syntax, time and count value to verify the SQL is returning some data in an acceptable amount of time.
If necessary, use the SQL Query Editor to modify the SQL query or to create your own.
-
Click OK and close the SQL Query Editor to return to the Cell Contents window.
-
Use the Setup Exe Calls and Setup SP Calls to set up application or stored procedure calls for the grid.
-
Click OK to save your changes and return to the Command Center window.
The Command Center window will reload the page automatically.
-
Verify the cell is displaying the grid data and make any necessary modifications using the Cell > Cell Contents function to re-open the Cell Contents window.
Setting up EXE (app) calls for a grid
For grid data, right-click an item on a grid to display one or more custom executable application calls within the typical grid context menu. For example:
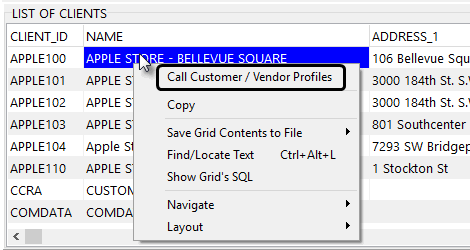
This allows you to add or delete calls to other TruckMate applications from the Command Center program, passing a value from a grid column.
|
The ability to create EXE calls for a grid requires a specific permission available in the Security > Business Events > Allow Changes section of Security Configuration KPI - Allow Access to Setup EXE Calls - Grid |
To create an EXE (application) call for a grid,
-
Select the desired grid.
-
From the Home tab, click the Cell button > Contents option to display the Cell Contents window.
-
Click the Setup Exe Calls button.
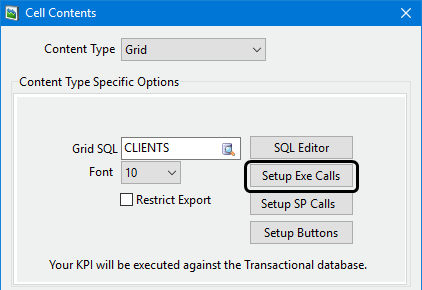
The TruckMate App Calls for Grid window is displayed.
-
Click the
 Insert Record button.
 -
Double-click the Exe Name field and select the exe (and Key) to call.
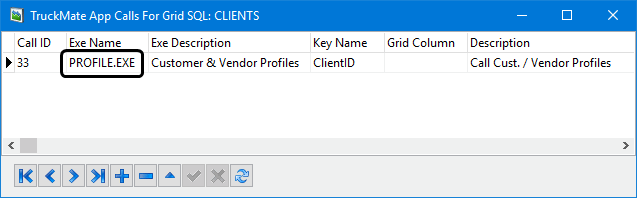
The pick-list includes a fixed list of apps that allow other apps to call them. (To add an exe to the pick-list, a TMW developer would need to modify that exe). Note that some executable names appear multiple times - e.g. you can call profile.exe and locate either a particular client or a particular vendor. Both are associated with profile.exe.
The Exe name and details will auto-populate the TruckMate App Calls for Grid window.
-
Click the Grid Column and use the pick-list icon to select a column name from your SELECT statement. The value of this column will be used to locate a record in the called app. For example, if you are adding a call to client profiles, you should select a column from your query that is a client ID (e.g. CLIENT_ID, ORIGIN, DESTINATION, etc.).
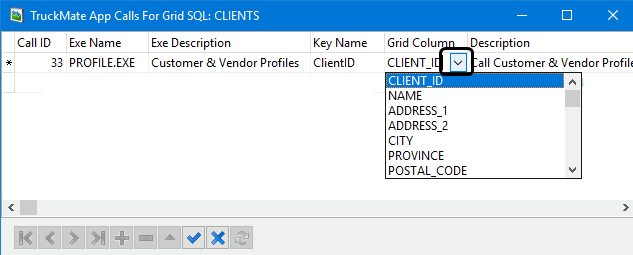
| This feature is only enabled for Grid type SQLs, and is disabled for Chart and Map SQLs. It is also disabled while adding or editing a Grid SQL (i.e. you must save your changes before trying to add a call). |
Setting up SP (stored procedure) calls for a grid
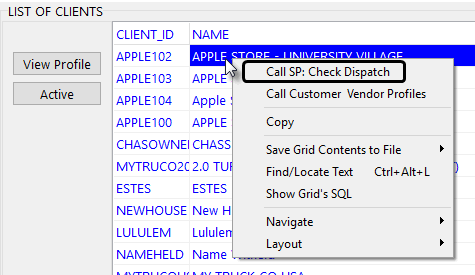
For grid data, right-click an item on a grid to display one or more stored procedure calls within the typical grid context menu.
This allows you to add or delete calls to a stored procedure, passing a value from a grid column. For example:
To create an SP (stored procedure) call for a grid,
-
Select the desired grid.
-
From the Home tab, click the Cell button > Contents option to display the Cell Contents window.
-
Click the Setup SP Calls button.
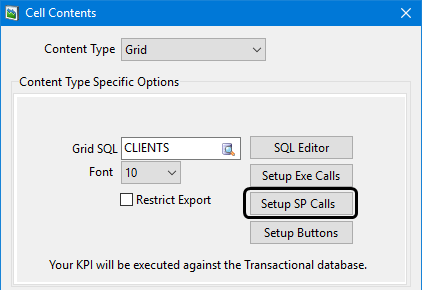
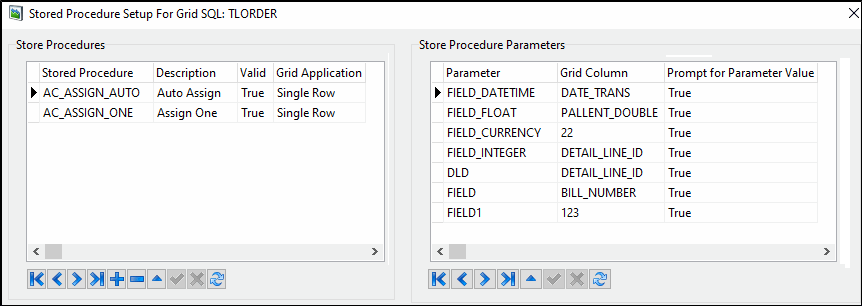
The Stored Procedure Setup for Grid SQL window is displayed.
-
Click the
Insert Record button on the left. -
Double-click the Stored Procedure field and use the drop-down list to select the item to call.
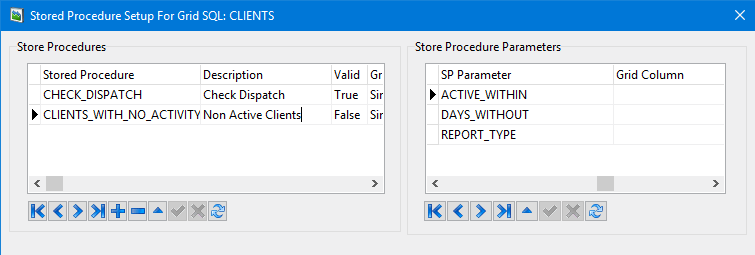
-
Scroll to the right and notice the Grid Application setting with options for Single Row or All Rows to control which items in the grid will be affected by this stored procedure.
-
Click
 Post to save.
 -
If the stored procedure has any stored procure parameters, enter the information using the grid on the right.
Note: Prompt for parameter value when executing a stored procedure in Command Center.
An Enter Parameter Values form was added to the Command Center program in TruckMate 2021.1 to pass parameters to a stored procedure.
You will be prompted to enter a missing grid parameter value required to execute a stored procedure. A new Prompt for Parameter Value field needs to to be set to True in the Stored Procedure Setup form since it will be set to False by default.
Setting up custom cell buttons for a grid
When setting up your grid cell contents, a new Setup Buttons feature allows you to create your own custom buttons associated with an existing executable call or a stored procedure call for the selected grid cell. For example:
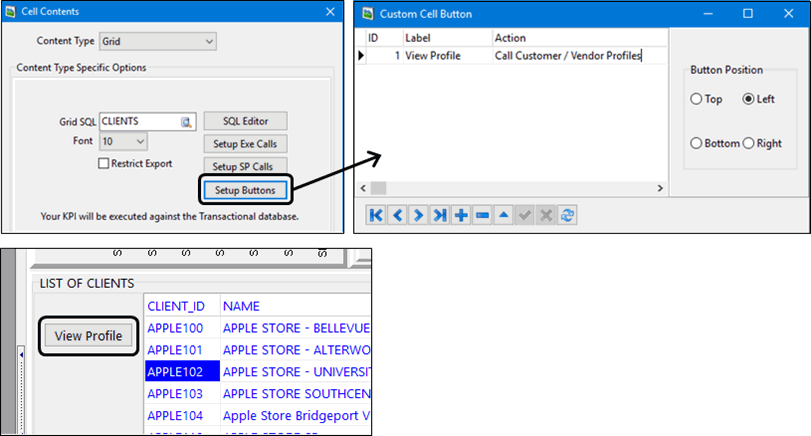
This allows you to create and display your own buttons to interact with the selected grid data by using an existing executable call or a stored procedure call. You may have to create the call first. See Setting up SP (stored procedure) calls for a grid.
To create a custom button for a grid:
-
Select the desired grid.
-
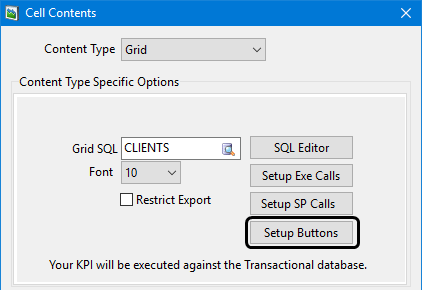
From the Home tab, click the Cell button > Contents option to display the Cell Contents window.
-
Click Setup Buttons.
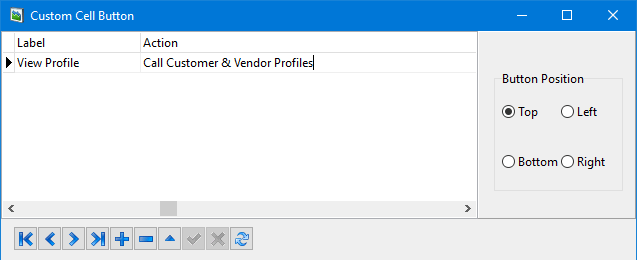
The Custom Cell Button window is displayed.
-
Click the
Insert Record button. -
Enter the text for the button label to be displayed on the window. Keep it short.
-
Double-click the Action field and select the feature or stored procedure call.
-
Select the button position.
-
Click
Post to save. -
Click OK to close the Cell Contents window.
The Command Center page window will refresh automatically and the buttons will be displayed.
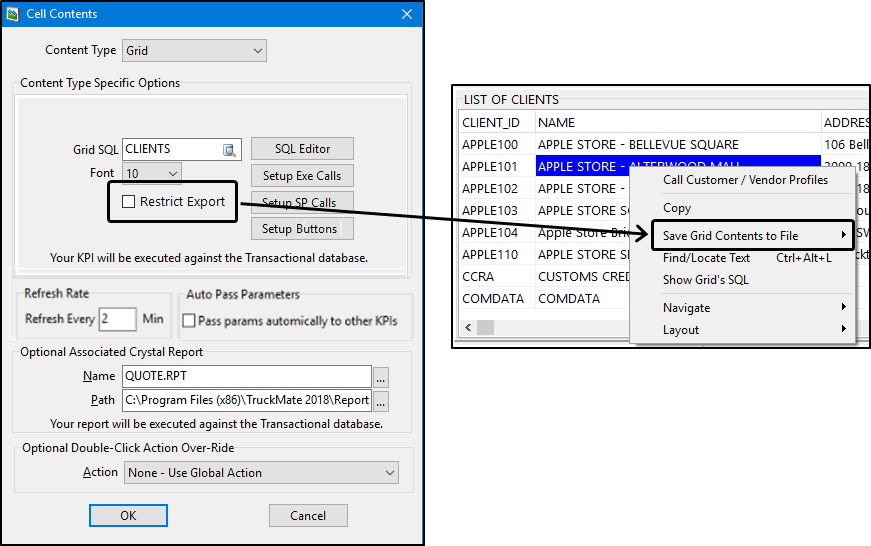
Restricting the export of grid data
-
The Restrict Export checkbox on the Cell Contents form for Grids controls whether users can export the data displayed within the grid to an external file. When the checkbox is cleared, the Save Grid Contents to File right-click shortcut menu item is enabled for that cell.
Creating and modifying a Map
-
Switch to the desired page and select the cell. (Create a new level if necessary.)
-
Look at the Status bar at the bottom of the window to verify you are working on the correct cell location.
-
On the Home tab, click Cell > Contents.
The Cell Contents window is displayed.
-
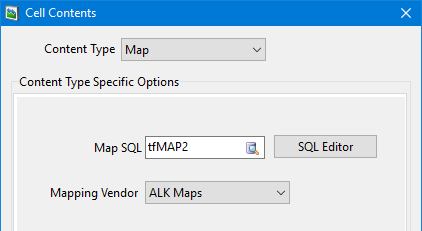
Set the Content Type to Map.
-
The top half of the Cell Contents window displays options specific to this content type.
-
Click the
Chart SQL search icon to select the desired Map type SQL query. -
Click the Mapping Vendor button and select a vendor.
-
Click the SQL Editor button.
The SQL Query Editor window is displayed.
-
Click the Test SQL button and check the syntax, time and count value to verify the SQL is returning some data in an acceptable amount of time. If necessary, use the SQL Editor to modify the SQL query or to create your own.
-
Click OK and close the SQL Query Editor to return to the Cell Contents window.
-
Click OK to save your changes and return to the Command Center window.
-
Verify the cell is displaying the map data and make any necessary modifications using the Cell > Cell Contents function to re-open the Cell Contents window.
The Command Center window will reload the page automatically.
Creating and modifying a Picture
-
Switch to the desired page and select the cell. (Create a new level if necessary.)
-
Look at the Status bar at the bottom of the window to verify you are working on the correct cell location.
-
On the Home tab, click Cell > Contents.
The Cell Contents window is displayed.
-
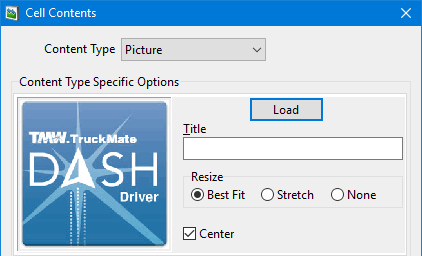
Set the Content Type to Picture.
-
The top half of the Cell Contents window displays options specific to this content type.
-
Click the Load button to open a Select Image form.
-
Browse to locate and select the picture file.
Note: Picture files must be in JPG format and have a file size of 128K or smaller.
-
Enter a Title as a name or description of the image.
-
Select the Resize and Center (vs left justified) options where applicable.
-
Click OK to save your changes and return to the Command Center window.
The Command Center window will reload the page automatically.
-
Verify the cell is displaying the picture and make any necessary modifications using the Cell > Cell Contents function to re-open the Cell Contents window.
Creating and modifying a Database Picture
-
Switch to the desired page and select the cell. (Create a new level if necessary.)
-
Look at the Status bar at the bottom of the window to verify you are working on the correct cell location.
-
On the Home tab, click Cell > Contents.
The Cell Contents window is displayed.
-
Set the Content Type to DB Picture.
-
The top half of the Cell Contents window displays options specific to this content type.
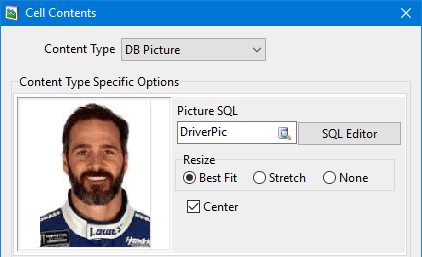
This type of cell content allows you to use pictures stored in the database to be displayed in the cell. In addition to the re-size options available for loading pictures from an image file, a SQL entry is needed to fetch the picture from the database. You can either select a pre-defined SQL statement or use the SQL editor button to define your own SQL statement.
The power of this type lies in the fact the picture displayed in the cell is not static so if a proper parameter is used, the picture can be different based on the value of the parameter. For example, to display a driver’s picture in a page with various KPIs related to a single driver (using a parameter, DRIVER_ID), set the DB Picture SQL to:
SELECT DRIVER_BITMAP FROM DRIVER WHERE DRIVER_ID = :DRIVER_IDNote: The SQL for the Picture must:
-
Only select a single row (a FETCH FIRST ROW ONLY is included by default).
-
Select only a single column, and that column must be of 'BLOB' type, and must store a JPEG file type.
-
-
Click the
Chart SQL search icon to select the SQL query. -
Click the SQL Editor button.
The SQL Query Editor window is displayed.
-
Click the Test SQL button and check the syntax, time and count value to verify the SQL is returning some data in an acceptable amount of time. If necessary, use the SQL Editor to modify the SQL query or to create your own.
Note: Picture files must be in JPG format and have a file size of 128K or smaller.
-
Select the Resize and Center (vs left justified) options where applicable.
-
Click OK to save your changes and return to the Command Center window.
The Command Center window will reload automatically.
-
Verify the cell is displaying the chart and make any necessary modifications using the Cell > Cell Contents function to re-open the Cell Contents window.
Creating and modifying a Webpage
-
Switch to the desired page and select the cell. (Create a new level if necessary.)
-
Look at the Status bar at the bottom of the window to verify you are working on the correct cell location.
-
On the Home tab, click Cell > Contents.
The Cell Contents window is displayed.
-
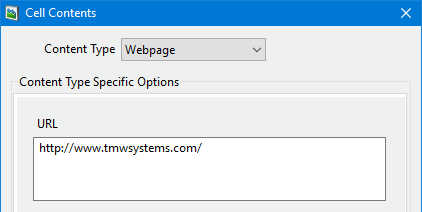
Set the Content Type to Webpage.
-
The top half of the Cell Contents window displays options specific to this content type.
-
Enter the URL (including the http:// tag) of the web page you want to access.
-
Click OK to save your changes and return to the Command Center window.
The Command Center window will reload the page automatically.
-
Verify the cell is displaying the chart and make any necessary modifications using the Cell > Cell Contents function to re-open the Cell Contents window.
Creating and modifying a Database Webpage
-
Switch to the desired page and select the cell. (Create a new level if necessary.)
-
Look at the Status bar at the bottom of the window to verify you are working on the correct cell location.
-
On the Home tab, click Cell > Contents.
The Cell Contents window is displayed.
-
Set the Content Type to Webpage.
-
The top half of the Cell Contents window displays options specific to this content type.
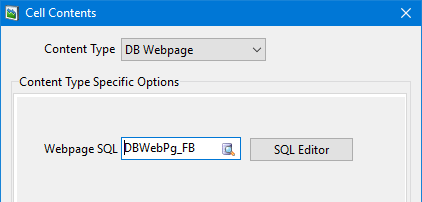
This web page will be based on a database query. You can select a pre-defined SQL query or create one with SQL editor by selecting the SQL Editor button (no hard coded URL). An additional option is available that allows you to define parameters for URLs. Use [@NAME] to define your parameter with in the URL, once a value is entered for the parameter it can be used multiple times within the page.
The SQL for this type must:
-
Select only a single row (by default, a
FETCH FIRST ROW ONLYis included). -
Select only a single column, and that column must be of string type.
An example of the power of this is to create a grid KPI listing FB’s, including a column named BILL_NUMBER. Then, drill-down and create a WebPage KPI. For the URL, copy/paste the TMW-Imaging URL for viewing FB-related documents from codes maintenance. Replace the codes maintenance parameter name,
%i,with [@BILL_NUMBER]. This will allow you to view any/all images stored in TMW-Imaging related to the given FB when you use the "Assign Current Value to Parameter and Drill-Down" option from the grid.+ Note: If the SQL for the DB Webpage KPI contains a SQL parameter, then the URL parameter (if one exists) will not be listed in the Parameters Form for the page until you assign the SQL parameters (so the SQL can be opened to get the URL with possibly embedded parameters).
-
-
Click the
Chart SQL search icon to select the SQL query. -
Click the SQL Editor button.
The SQL Query Editor window is displayed.
-
Click the Test SQL button and check the syntax, time and count value to verify the SQL is returning some data in an acceptable amount of time. If necessary, use the SQL Editor to modify the SQL query or to create your own.
-
Click OK to save your changes and return to the Command Center window.
The Command Center window will reload automatically.
-
Verify the cell is displaying the chart and make any necessary modifications using the Cell > Cell Contents function to re-open the Cell Contents window.
Creating Cell Levels
Every cell on the page can be used to contain a number of different content displays arranged like a stack of pancakes. For example, you could use one cell to display three completely different charts displaying different data and use the Drill -Up and Drill-Down buttons to toggle between the different levels.
You can add a level to the selected Cell either Above or Below the currently selected level. Cell Levels allow you to have different kinds of data and different content types all within one Cell.
-
Select the desired cell where the levels will be displayed.
-
From the Home tab, click the Levels button > Add Level Below option.
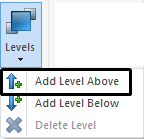
A new level is added to the Cell below the current level (now Level 2). You will now see the empty blank Cell you just created below the first one.
Note: Look at the status bar to see what Level you are on.
-
Add some contents to the cell.
-
Use the Drill Down and Drill Up arrow buttons on the toolbar to navigate between cell levels.
SQL section
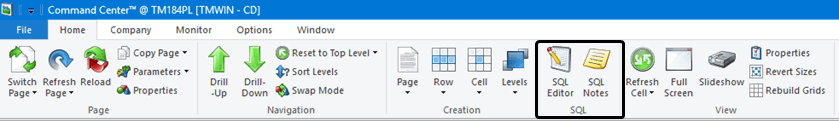
Using the SQL Editor
Each chart and grid in the Command Center program is based on KPIs and their associated SQL queries. These SQL queries providing the KPI data are added and edited via the SQL Query Editor window. Click the SQL Editor button on the Home tab to open the SQL Query Editor window.
![]()
Use the SQL Query Editor to create new SQL queries, test them, upload them to the TruckMate website as a KPI text file, share them with others and edit existing KPI SQL queries. This is the same window that opens if you are editing the cell contents and click the SQL Editor button.
|
Access the SQL editor for any given cell content type requires a specific permission available in the Security > Business Events > Allow Changes section of Security Configuration
|
View section
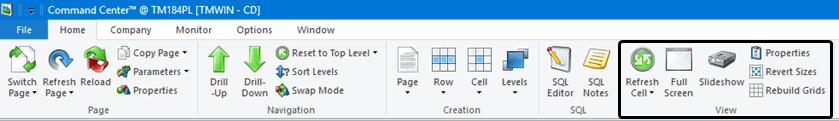
Refreshing a cell
Clicking the top part of the Home tab > Refresh Cell button will refresh just the currently selected cell.
![]()
To set up an automatic refresh, click the Refresh Cell > Refresh Every option and enter a value to indicate how many minutes before the cell data will be refreshed.
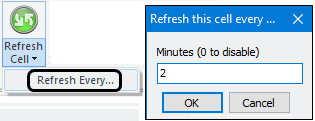
If the value for the cell refresh is less than the Global Cell Refresh Limit configured within the Application Configurator program, a warning message will be displayed and the refresh the cell value will be reset to match the Global Cell Refresh Limit value.
A Global Cell Refresh Limit of zero allows you to set up KPI pages with different auto-refresh time interval for individual cells.
If the cells within a page are set to different refresh times regardless of whether these times are smaller or larger than the page refresh interval, the page refresh will be automatically set to 0. Conversely, if the cells within a page are set to different refresh times and you edit the page refresh time, all the cells on that page will automatically have their cell refresh time set to match the page refresh time.
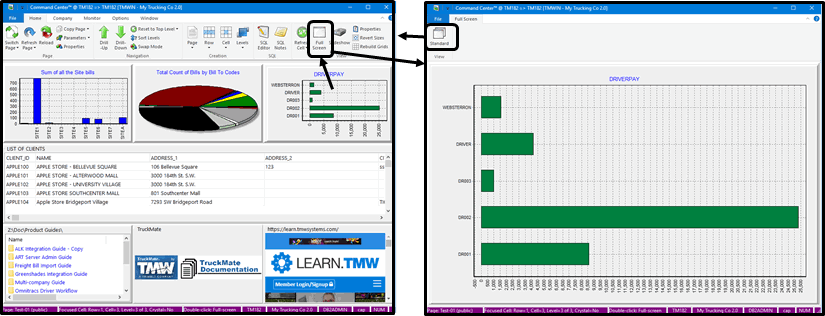
Switching between full screen, standard views
To have a closer look at contents for a particular cell, select the cell and click the Home tab > Full Screen button.
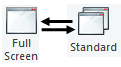
Click the Standard button to return to the regular Command Center window.
Viewing a slideshow
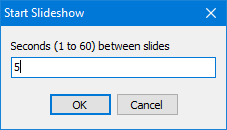
-
Click the Home tab > Slideshow button to have the window display each of the cells on the Command Center window for this page one by one in full screen mode. The system will prompt you to enter a time interval to indicate how long to display each page before moving on to the next.

-
Use the navigation bar displayed at the top of the full screen view to pause, stop, or move to another page before the time interval change occurs.

-
Click the Stop button to return to the regular Command Center window.
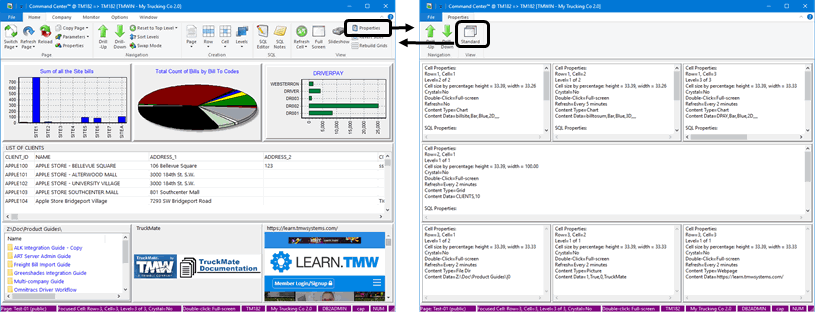
Viewing the Cell Properties
-
Click the Properties button on the far right of the Command Center window to view the page with text memo boxes listing the properties for each of the cells.

-
Use the Drill-Up and Drill-Down buttons to move between levels within each cell.
-
Click the Standard button to return to the regular Command Center window.
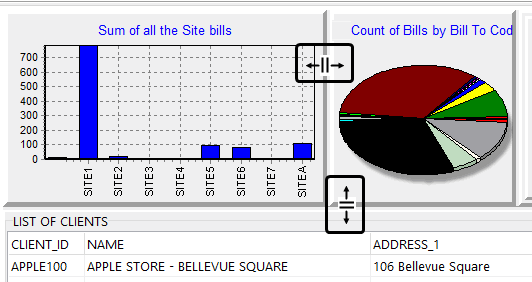
Resizing Rows/Cells and reverting back
Hovering your mouse over the border between two cells will display a horizontal or vertical splitter icon. ![]()
Click and drag the splitter icon to move the borders and adjust the horizontal and vertical dimensions associated with the rows and cells.
The Command Center will keep these row/cell sizing changes and reflect these changes the next time you open this page.
| When you export or copy a page there is a checkbox option called Copy row/cell sizing that allows you to transfer the resizing changes along with the page or have the rows and cells revert back to being evenly spaced. |
Use the Home tab > Revert Sizes button to reverse all your row/cell size changes and revert to default/equal sizing.
The row/cell size percentage is displayed in the memo text for each cell when you go to the properties view. You are allowed to move splitters while in the properties view and see the percentages change.
Rebuilding Grids
After a database schema upgrade, Command Centre may present errors regarding the grid formatting of KPI cells when a page is opened. Should this ever occur, use the Home Tab > Rebuild Grids button to remedy the errors. This function loops through each KPI cell and performs a save layout function to refresh the information in the database schema.
Zooming in and out of a Chart
If some of your cell content charts are difficult to see based on the results that are displayed, you are able to zoom in on a rectangular area of a chart by clicking and holding the left mouse key and dragging down and to the right to draw a rectangle (and then letting go of the mouse key). This zoom function cannot be used for pie charts.
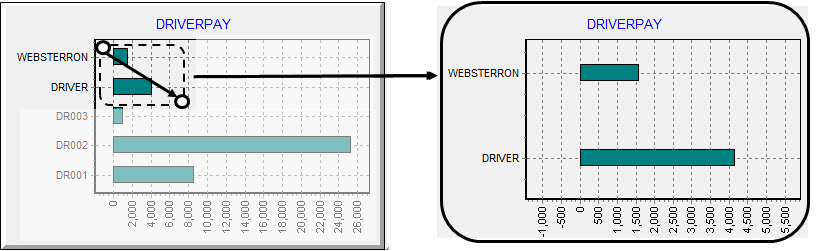
You may return the view to normal by drawing a rectangle via the same method, except in reverse, start with either the top right or bottom right corner (drag up or down and left).
You can also move the graph contents up/down/right or left to view data out of the graph range. Simply place your cursor in the graph area, click and hold down the right mouse button while moving the mouse. This will move the graph contents.
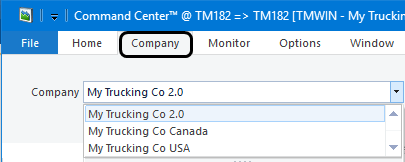
Company tab
If you are configured to use the Multi-Company features, the Company tab will let you select and switch over to viewing information for another company using the current page.
Monitor tab
The Monitor tab contains the standard TruckMate Monitor functions used by your System Administrator or IT support staff to record how the Command Center application is behaving. These are described in the TruckMate Advanced section of the online help system.
Options tab
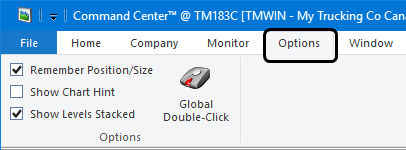
Remembering window position/size
The Remember Position/Size checkbox indicates whether you want to retain the window sizes and positions for all the TruckMate application windows upon exit. When the program is re-opened, this window will maintain its previous size and appearance. This includes any undocked tab windows.
Showing a chart hint
Indicates whether you want text describing the contents to be displayed when you hover over a particular entry within a Chart. If you position your mouse over a part of a chart and leave it there for a second, a pop-up hint will show you the actual values for that point.
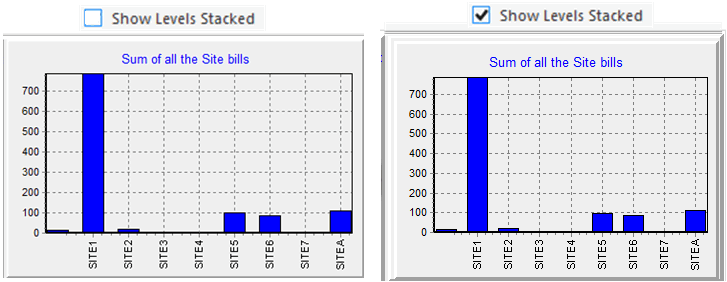
Showing cells with stacked levels
When selected, the Show Levels Stacked alters the appearance of the border surrounding any KPI cells that contain levels. Any KPI cell with multiple levels will be displayed with a concentric raised panel for each level. As such, you will be able to see at a glance which KPI cells have multiple levels, and how many. Note that this will slightly reduce the size of the cell contents. If this is an issue, clear the option and all the cells will display as if they only have one level.

Troubleshooting - Command Center
Performance Issues on Pages / Cells
This could be a result of new or modified KPIs that take longer than usual to execute. Testing KPIs should always be done via the SQL Query Editor to ensure all KPIs are able to refresh within a reasonable response time. Usual response times range between 10-20 seconds or less, even on large, complex databases. If you experience responses much longer than this, please contact TMW Support.
I cannot see any Sample Pages displayed when opening the Command Center program
This is likely due to the Sample Pages being installed on a server or PC using one of the system administrator accounts as the page owner (e.g. DB2ADMIN). The page owner must log in and copy the pages to an appropriate power user or system administrator.
I cannot access any KPIs via the SQL Query Editor
This is due to the Sample SQL’s (KPIs) not being installed by your administrator. The Sample SQL script must be applied using the schema owner account and should be completed by your local TruckMate system administrator. Once this is done, you will have access to them. Another option is to download them via the SQL Query Editor from the TMW Systems KPI download webpage if you have user access and permissions to that web page.