Viewing your CSA safety data
If your company has registered for the Trimble Compliance, Safety, and Accountability (CSA) Management service, you can view your safety ratings in Trimble Web Products. Your safety ratings are based on data recorded with the Federal Motor Carrier Safety Administration (FMCSA). The information is updated monthly. It provides your statistics in comparison with other drivers working for your current employer.
The Behavior Analysis and Safety Improvement Categories (BASICs) for commercial motor vehicle (CMV) violations are defined as follows:
| Category | Definition | Sample violations |
|---|---|---|
Cargo-Related |
Failure to properly prevent shifting loads, spilled or dropped cargo, or unsafe handling of hazardous materials on a CMV. |
Improper load securement, cargo retention, and hazardous material handling |
Vehicle Maintenance |
Failure to properly maintain a CMV. |
Brakes, lights, and other mechanical defects, failure to make required repairs |
Fatigued Driving (Hours-of-Service) |
Operation of CMV by driver while ill, fatigued, or in non-compliance with the Hours-of-Service (HOS) regulations. |
Exceeding HOS, maintaining an incomplete or inaccurate logbook, operating a CMV while ill or fatigued |
Unsafe Driving |
Operation of CMV in a dangerous or careless manner. |
Speeding, reckless driving, improper lane change, inattention |
Controlled Substances and Alcohol |
Operation of CMV by driver while impaired by alcohol, illegal drugs, or misuse of prescription or over-the-counter medications. |
Use or possession of controlled substances or alcohol |
Driver Fitness |
Operation of CMV by drivers who is unfit to operate a CMV due to lack of training, experience, or medical qualifications. |
Failing to have a valid and appropriate commercial driver’s license, being medically unqualified to operate a CMV |
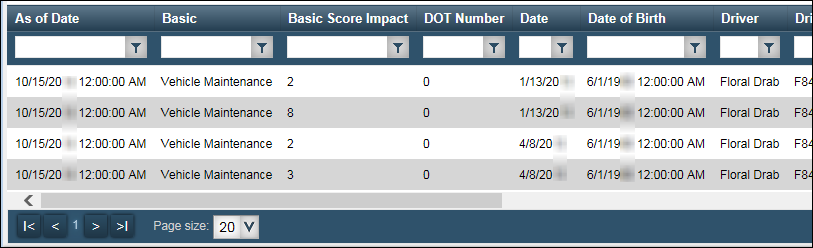
To view your CSA safety data, go to Menu > Driver > CSA > CSA Stats.
Summary graph
The summary graph displays the violations on your record.
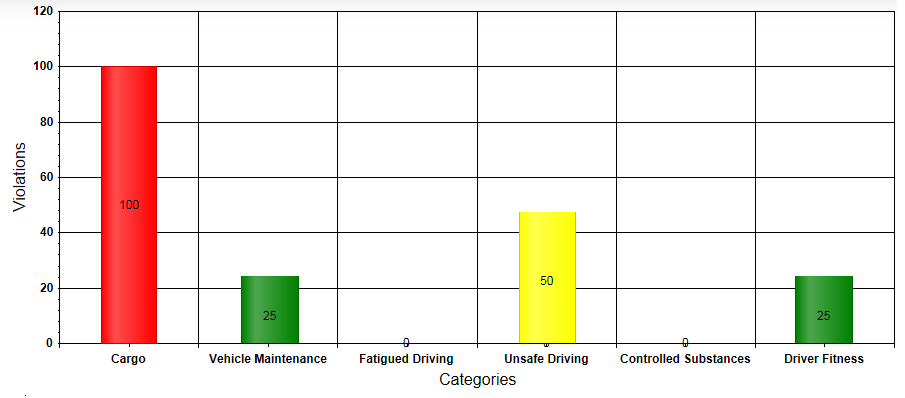
The height of the bar and the corresponding number indicate your percentile ranking within the organization for each BASIC category. The higher the rank, the worse your performance compared to the other drivers in the company with violations in the same category.
For example, if you have an Unsafe Driving percentile of 50, it means that 50% of the drivers in the company with violations in the Unsafe Driving category have a lower score than you.
The colors of the bars can be green, yellow, or red, depending on the upper and lower percentile limits set by the Trimble Web Products administrator.