Advanced report editing
Advanced report editing includes working with drill-down reports and calculated columns. The following sections explain how to set up and use these features.
Working with drill-down reports
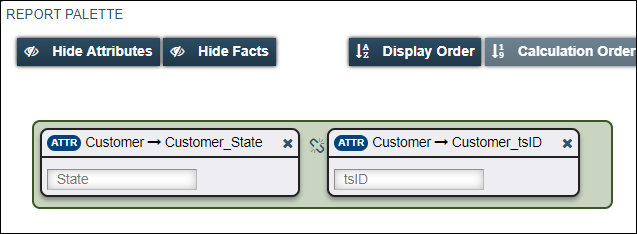
By default, when you add two or more attributes to the Report Palette, they are not linked. This causes Data Warehouse Explore to generate a drill-down report.
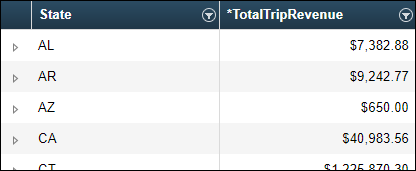
A drill-down report groups data by attribute. For example, you might have a report that groups data by customer state and then by company ID.
image:DW-AdvReportEditing/image1.png[, 567,91
If you create this type of drill-down report, the Generated Report section displays a collapsed list of the customer’s states.
To see the customers within a state, you must click ![]() to expand its row (drill-down).
to expand its row (drill-down).
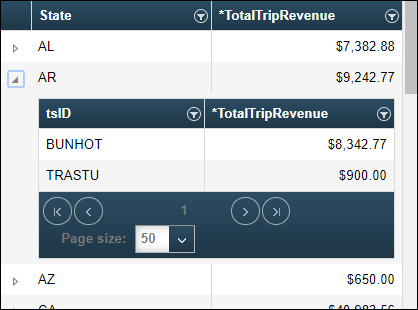
To collapse the row and hide the drill-down information, you click its ![]() collapse symbol.
collapse symbol.
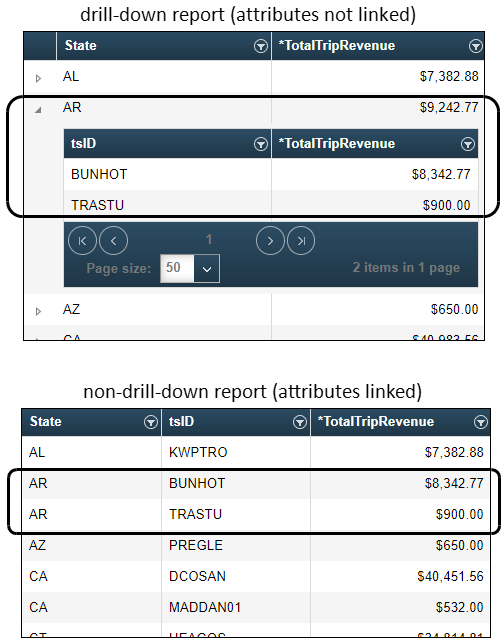
If you do not want your report to be a drill-down report, you must link its attributes together. This illustration shows the difference between drill-down and non-drill-down reports.
Removing drill-down functionality
When you add two or more attributes to a report, Data Warehouse Explorer creates a drill-down report automatically. This happens because the attributes are not linked by default. Linking attributes causes Data Warehouse Explorer to create the report without drill-down capability.
To link attributes and remove drill-down functionality between attributes, follow these steps:
-
Go to Menu > Reveal.Business Reporting > Data Warehouse Explorer.
The Data Warehouse page opens. -
Do one of the following:
-
Load the report for which you want to modify drill-down functionality.
-
-
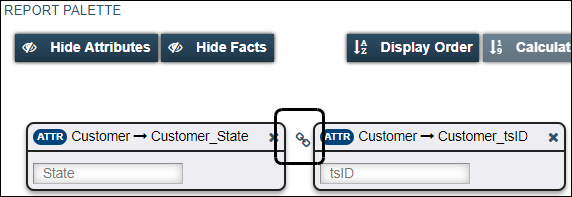
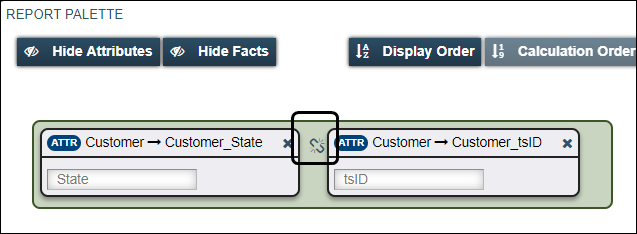
In the Report Palette, note the Link icon located between attributes. The icon acts as a toggle, allowing you to link or unlink attributes.
Clicking the icon in the state shown here would link the attributes.
Once the attributes are linked:
-
The drill-down functionality is removed for those attributes.
-
A green boundary is placed around the linked attributes.
-
The icon changes to
 two broken links.
Note: Clicking it in this state would unlink the attributes and restore the drill-down functionality.
-
-
Click
 the link icon located between the attributes for which you want to remove drill-down functionality.
 -
Click Run.
The Generated Report section displays the results.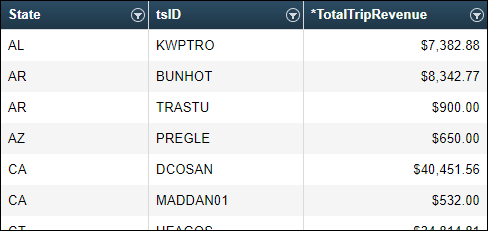
Restoring drill-down functionality
When you remove drill-down functionality from attributes, Data Warehouse Explorer generates a report that looks similar to a Microsoft® Excel table. It displays data in rows and columns without grouping the data. If you want to restore a report’s drill-down functionality, you unlink attributes.
To unlink attributes and restore drill-down functionality between attributes, follow these steps:
-
Go to Menu > Reveal.Business Reporting > Data Warehouse Explorer.
The Data Warehouse page opens. -
Load the report to which you want to restore drill-down functionality.
-
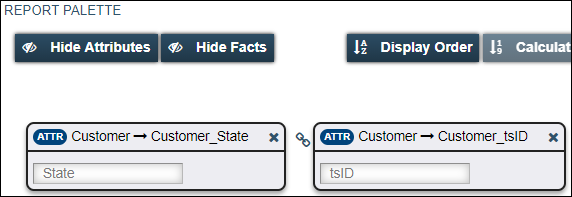
In the Report Palette, note the Link icon located between attributes. The icon acts as a toggle, allowing you to link or unlink attributes.
As shown here, clicking the icon would unlink the attributes and restore the drill-down functionality.
Once the attributes are unlinked:
-
The drill-down functionality is restored for those attributes.
-
The green boundary is removed from the attributes.
-
The icon changes to
 unbroken chain links.
Clicking it in this state would link the attributes.
-
-
Click
 the link icon located between the attributes for which you want to restore drill-down functionality.
 -
Click Run.
The Generated Report section displays the results.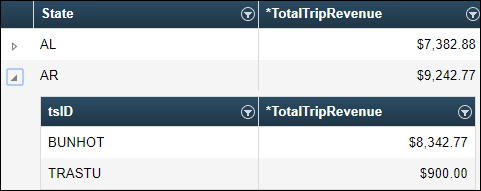
Working with calculated columns
You can add calculated columns to the reports created in the Data Warehouse Explorer. These columns perform mathematical calculations. Data Warehouse Explorer supports two types of calculated columns:
-
Custom calculated columns
Custom calculated columns are specific to a report and are not stored in the database. If you want to use them in other reports, you must recreate them. There are two types of custom calculated columns, mathematical columns and logical columns. -
Predefined calculated columns
Predefined calculated columns appear in the Facts section of the Data Navigator.They are:
-
Dependent on the fact tables in your source database
-
Not specific to a report
-
Stored in your Data Warehouse database and available for use with other reports
Notes:
-
Data Warehouse Explorer does not contain default predefined calculated columns.
-
Predefined calculated facts are created using Microsoft SQL. If you want to create predefined calculated facts, contact your Trimble Data Warehouse Support representative.
-
Depending on your Data Warehouse setup, predefined calculated facts may have an asterisk (*) before the column name. If you are unsure as to which facts are predefined calculated columns, contact your Data Warehouse administrator.
-
Adding custom calculated columns to reports
Custom calculated columns are attribute columns. They perform calculations or evaluations based on other columns in your report.
They:
-
Do not contain data from your source database
-
Are not saved to the Data Warehouse database
Note: To use these calculated columns in other reports, you must recreate them.
Data Warehouse Explorer supports two types of custom calculated columns:
-
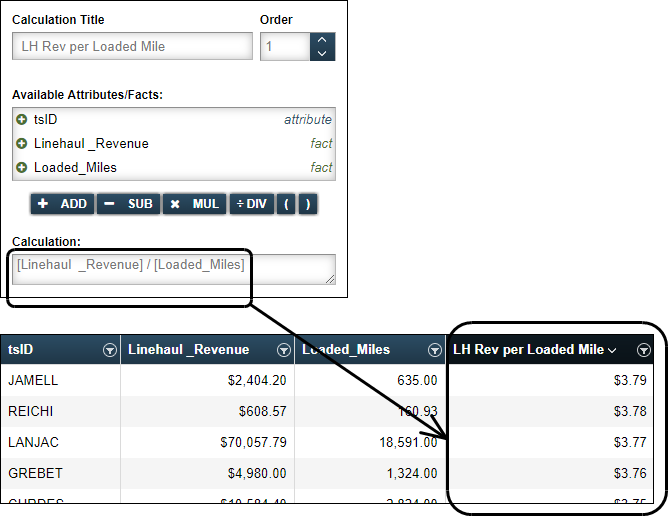
Mathematical columns use fact columns to perform mathematical calculations.
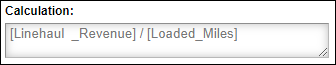
This illustration shows an example of a custom calculated column in a report. The LH Rev Per Mile column takes the values from the Linehaul_Revenue column and divides them by the values in the Loaded_Miles column.
This example calculates the line haul revenue per loaded mile.
-
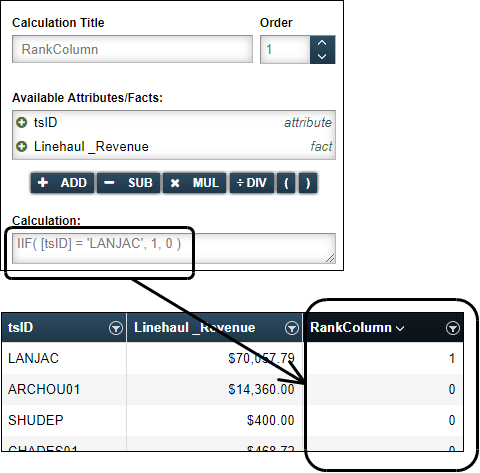
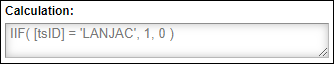
These calculated columns evaluate attributes. When the attribute is true, a value is assigned to the calculated column.
For example, this column uses the logic IIF( [tsID] = LANJAC, 1,0 ) to evaluate the tsID attribute column. It assigns a zero (0) to all attributes that do not meet this criteria and a one (1) to any that do.
Notes:
-
For more information on the syntax, search DataColumn.Expression Property on the Microsoft Developers Network.
-
Data Warehouse Explorer cannot verify the accuracy of logical equations.
-
You create custom calculated columns in the Calculations pane of the report function section.
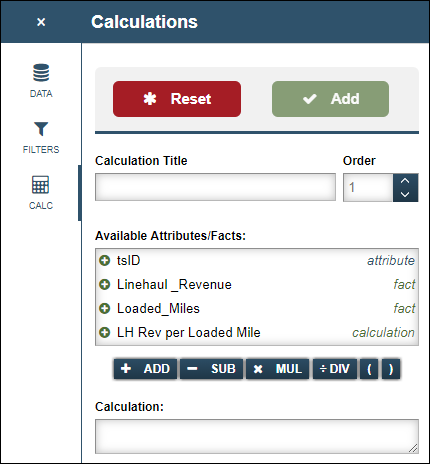
| Field | Definition |
|---|---|
Calculation Title |
Displays the calculated column name |
Available Attributes/Facts |
Lists the attributes and facts from the Report Palette that you can use to create a custom calculated column |
Operators |
Used to build mathematical equations in the Calculation section |
Calculation |
Displays the equation as you build it |
|
Saves the column and adds it to the report |
To add custom calculated columns to reports, follow these steps:
-
Go to Menu > Reveal.Business Reporting > Data Warehouse Explorer.
The Data Warehouse page opens.If you are already working on a report, go to Step 3.
-
Do one of the following:
-
Load the report for which you want to update with a calculated column.
-
-
Click
 CALC
CALC
The Calculations pane opens. -
Determine which type of calculated column you want to create.
-
Mathematical
-
Logical
-
-
In the Calculation Title field, enter a name for the column.
-
Build the equation.
-
Mathematical calculations
-
In the Available Attributes/Facts section, select a fact by clicking its
 Add symbol.
The selected fact displays in the Calculation section. -
Select a mathematical operator.

-
Repeat Steps a-b as needed to finish the equation.
This illustration shows a sample mathematical equation.
-
Click Add.
The calculated column displays in the Report Palette. -
Click Save.
-
-
Attribute evaluation columns
-
In the Calculation section, enter the logic you want to use for the equation.
This illustration shows a sample logic equation.
-
Click Add
The calculated column displays in the Report Palette. -
Click Save.
-
-
-
To view the results, click Run.
-
To revise your equation, click
 Edit. The Calculations pane opens.
Adding predefined calculated columns to reports
To add a predefined calculated column to a report, follow these steps:
-
Go to Menu > Reveal.Business Reporting > Data Warehouse Explorer.
The Data Warehouse page opens.If you are already working on a report, go to Step 3.
-
Do one of the following:
-
Load the report for which you want to update with a calculated column.
-
-
Click
 Data.
Data.
The Data Navigator pane appears. -
In the Subject Areas section, select the subject area you want to use.
-
In the Facts section, double-click on the predefined calculated fact that you want to add to the report.
The system adds the fact to the REPORT PALETTE section.Notes:
-
Depending on your Data Warehouse setup, predefined calculated facts may have an asterisk (*) before the column name.
-
If needed, contact your Data Warehouse administrator to obtain the list of predefined calculated facts available to you.
-
-
To view the results, click Run.