Data Warehouse Explorer overview
First available in Trimble Web Products: 2016.6
Data Warehouse Explorer by Trimble is a separately licensed module for the Trimble Web Products that you can use to create dynamic reports to analyze your business activities. With Data Warehouse Explorer, you no longer need to request reports from reporting experts or learn complicated reporting tools such as SQL Server Reporting Services or Crystal Reports.
To build a report in Data Warehouse Explorer, you select Facts (numeric data) and Attributes (data descriptors). You select facts and attributes from the Data Navigator (the list of reporting elements) and then add them to the Report Palette (the report template). For details on these terms, see the Layout of the Data Warehouse Explorer page section below.
Data Warehouse architecture
Trimble Data Warehouse functions through a process called Extract, Transform, and Load (ETL). Trimble Data Warehouse reads (extracts) data from one or more servers and SQL databases. It then incorporates related data and changes (transforms) it from a relational model to star-schema design. Finally, it updates existing data and inserts (loads) new data into the Trimble Data Warehouse database.
The ETL process is managed on a Windows® server. It usually runs at a time each day when the system is primarily idle. The ETL process can be scheduled to run more frequently, if necessary.
The extract step identifies new and updated information from a source database that needs to be imported into the data warehouse.
The transform step happens when allocations and business rules are applied to the data. Each fact is associated with dimension attributes. For example, the Travelmile fact is associated with order, tractor, date of delivery, bill to, and consignee information.
The load step is last. In this step, new and changed facts and their associations to attributes are loaded into the Trimble Data Warehouse database.
General process that you follow when using Data Warehouse Explorer
The links in this process direct you to the help topics for each.
-
Create a report.
Create reports by adding Facts and Attributes to the Report Grid. -
Modify the report.
Change the column display name or rearrange columns. -
Save the report.
Save the report and determine who can see the report in Data Warehouse Explorer. -
Share the report.
You can export reports to Microsoft® Excel or publish them to the main menu.
Layout of the Data Warehouse Explorer page
The Data Warehouse Explorer page has multiple sections that control different aspects of the report building process.
This illustration shows the different sections of the Data Warehouse Explorer page.
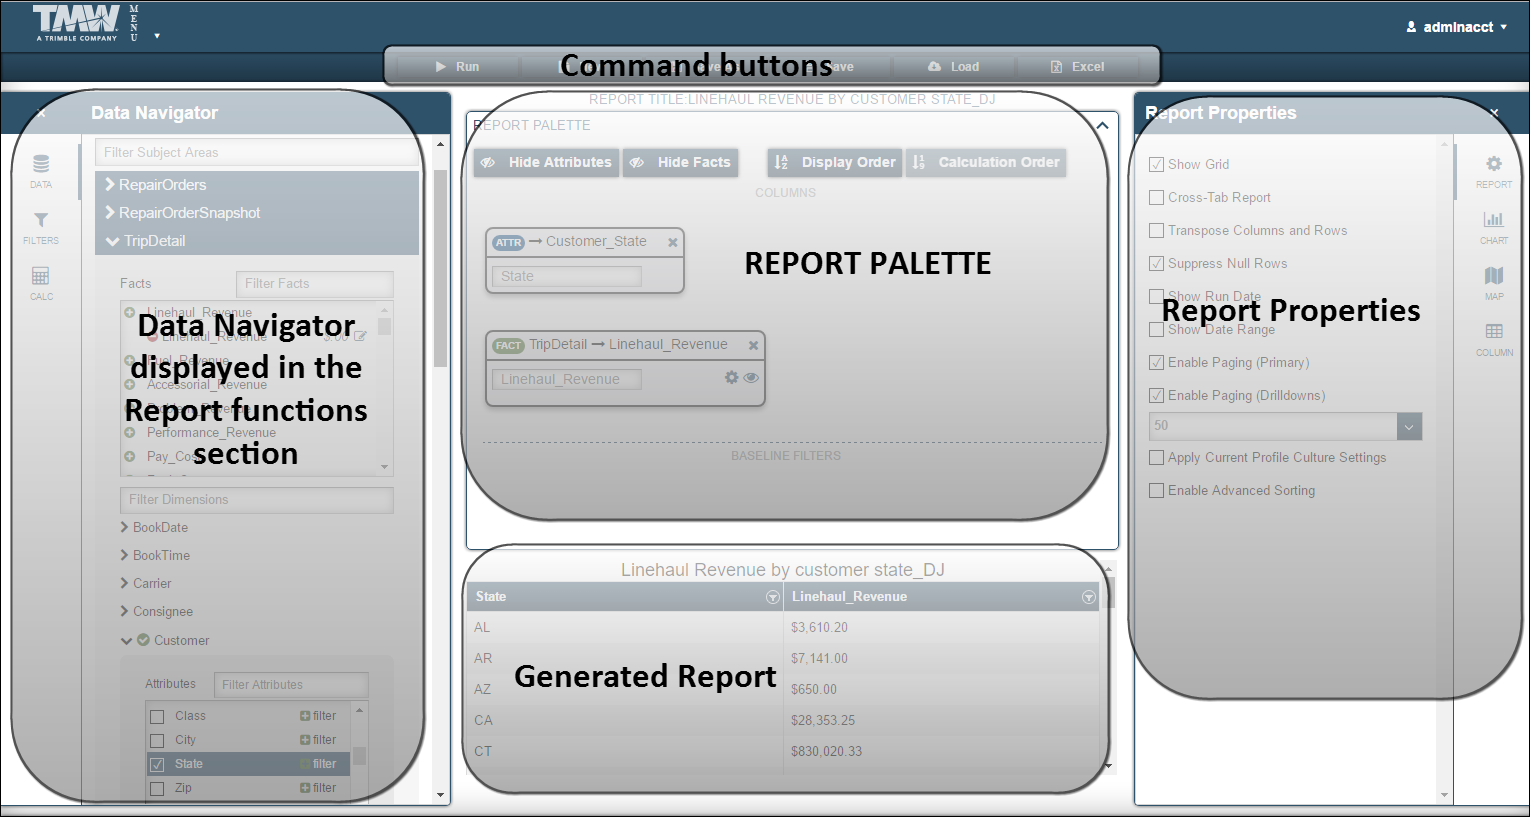
Command Buttons |
Allows you to perform the following actions:
|
Data Navigator |
Contains the elements you use to build reports.
|
Report Palette |
Provides a visual representation of the report It shows Facts and Attributes. |
Generated Report |
Displays the generated report |
Report Properties |
Allows you to set up the following:
|
Data Warehouse Explorer terms
While working in Data Warehouse Explorer, you may come across these terms.
- Calculated fact/column
-
Data Warehouse Explorer has the ability to perform basic mathematical calculations. When you create a report, you can add a Calculated fact/column to the Report Grid.
Calculated facts/columns are not actual data from your source database. They provide:
-
The instructions Data Warehouse Explorer uses to perform calculations on other facts in your report
-
The place for the calculations to be displayed in your report
-
- Column formatting
-
Fact column formatting allows you to change how the data displays in Data Warehouse Explorer.
You can choose from three display options:
-
Currency
Data Warehouse Explorer displays the results with a currency symbol. -
Numeric
Data Warehouse Explorer displays the results as a regular number. -
Percent
Data Warehouse Explorer displays the results as a percentage.
You can adjust the number of decimal places the column displays.
-
- Drill-down
-
Data Warehouse Explorer creates a drill-down report when you add two or more attributes to the Report Grid. Drill-down reports allow you to click on an
 Arrow to expand a row of data. If you click on the
  Arrow, the system collapses the row.
 - Filters
-
Filters are conditions that reduce the amount of data retrieved from the Data Warehouse database each time you run your report.
- Parameterized Filter
-
The Parameterized Filter window allows you to enter specific criteria to help narrow the filter parameters.
Data Warehouse Explorer concept
A data warehouse is a physically separate database. It organizes your company’s business information so that it is accessible for reporting and analysis. Reporting tools access and arrange this information to answer business questions.
Data Warehouse Explorer classifies business data into two groups: facts and dimension attributes. Facts are numeric measurements of your business activity. Examples of facts are revenue, cost, miles, and tractor count. Dimension attributes describe the factual data and put it into context. Common attributes include shipper, consignee, tractor, trailer, driver, and delivery date.
With Data Warehouse, you can combine facts and attributes to analyze your business activities and answer business questions:
-
What are my best lanes on a revenue per mile basis?
-
Do we generate more margin per day on trips that are under 500 miles in length or over 500 miles in length?
-
If I look at my best lanes on a round-trip basis, would my best lanes still be the best? What percentage of each day are my trucks actually engaged in revenue-producing activity?
-
How do my Freightliner tractors measure up to my Kenworth tractors in revenue production, miles driven, and maintenance costs?
-
Are my 2015 Macks performing as well as my 2017 Macks?
These questions can be answered by running separate reports against your transactional databases, but Data Warehouse Explorer can answer these questions with more speed and flexibility.
With Data Warehouse Explorer, you do not need a final report product in mind before you begin. You can build on reports by adding or removing columns as you refine or redefine your search. You do not have to start over.