Summarizing data in grids
First available in TMW Operations: 14.20.122
You can create and customize summaries of data in any grid. Summarizing data allows you to organize information for quick analysis. You can select from a list of existing simple functions to view sums, counts, averages, and minimums and maximums. You also can build and apply custom functions to create the summaries you need. Location and appearance settings allow you to design where and how summaries appear.
Overview of the Grid Customizer window
You use the Grid Customizer window to create and customize summaries in data grids. To access the Grid Customizer, right-click in any grid and select Edit Grid Summaries.
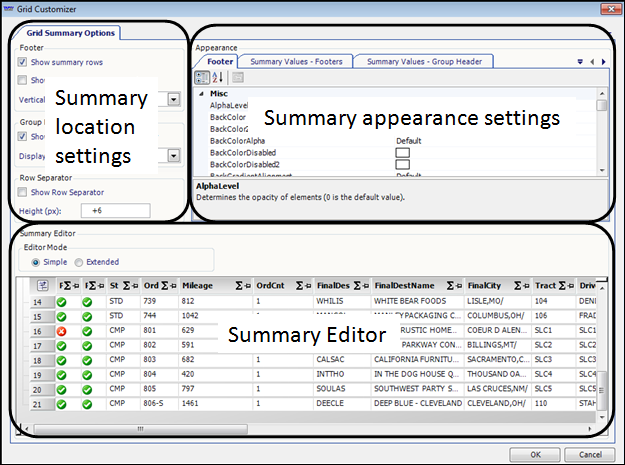
The three sections of the Grid Customizer window:
-
Summary location settings
Use the summary location settings to choose where your summaries appear. -
Summary appearance settings
Use the summary appearance settings to design how your summaries appear. -
Summary Editor
Use the options in the Summary Editor section to choose which data to summarize and how. You can summarize data by choosing from existing simple functions or building and applying custom functions. This section also offers a preview of any customizations you make to how and where summaries appear.Note: Except for applying functions and customizing how and where summaries appear, changes you make to fields in the Grid Customizer window will not be saved. For example, you can rearrange columns or use the Field Chooser to add columns in the Grid Customizer window, but your changes will not be saved when you exit the Grid Customizer window and return to the grid.
Applying functions
You can apply functions to summarize any column in a data grid. You can apply an existing simple function or build a custom function.
The following list of existing simple functions offers some standard ways of summarizing data:
-
Average
-
Count
-
Minimum
-
Maximum
-
Sum
If you want to summarize your data according to a function not offered on this list, you can build a custom function from a list of functions and operands.
Applying an existing function
Use the following procedure to summarize data by choosing from a list of existing simple functions.
-
If you have a saved layout you would like to use, load the layout.
-
Right-click in the grid containing data you want to summarize.
A shortcut menu appears. -
Select Edit Grid Summaries.
The Grid Customizer window opens. -
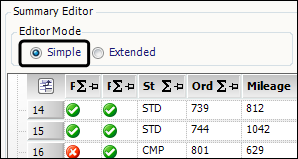
In the Summary Editor section, verify that Simple is selected.
-
Click the
 sigma in the header of the column you want to summarize.
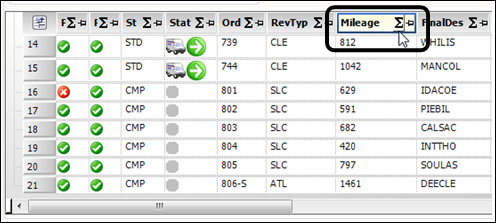
The Select Summaries window opens.
-
Select the checkbox of the function you want to use.
Note: You can select more than one function. checkboxes are disabled for any functions not available for the column you selected.
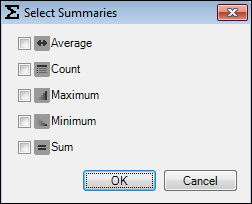
Average
Averages the values in the column
Count
Totals the number of rows in the column
Note: If a grid cell contains no value, it is still counted as a row in the final total for this kind of summary.
Maximum
Displays the highest value in the column
Note: If you apply this function to a column with alphabetical values, the summary will show the row starting with the letter closest to the end of the alphabet.
Minimum
Displays the lowest value in the column
Note: If you apply this function to a column with alphabetical values, the summary will show the row starting with the letter closest to the beginning of the alphabet.
Sum
Calculates the value of all numbers in the column
-
Click OK.
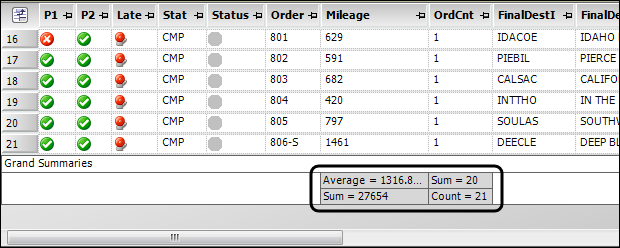
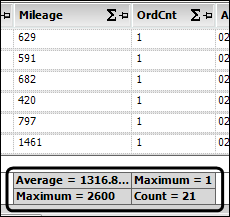
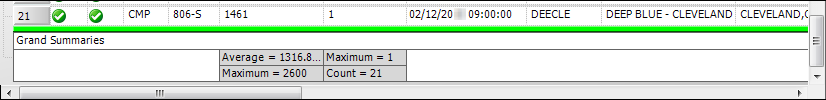
The result of the function you selected appears in a summary cell below the column.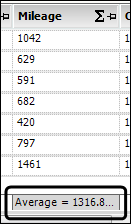
-
Click OK to close the Grid Customizer window.
The grid now displays a summary row and the result of the function you chose.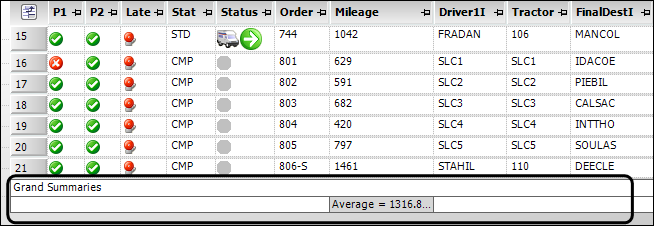
-
Save the grid layout.
-
If you loaded and added the summary to a saved layout, right-click on the grid and select Save Layout.
-
If this layout is a new layout, follow these steps to save it.
-
Right-click on the grid and select Save as New Layout.
The Save Grid Layout window opens.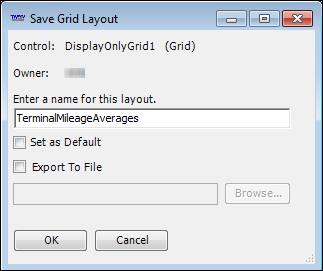
-
Enter a name for the new layout.
-
If you want this layout to be your default layout, select the Set as Default checkbox.
-
Click OK.
-
-
-
Assign the layout to users or groups of users.
Building and applying a custom function
If you want to summarize your data in a way not available from the list of existing simple functions, you can build a custom function.
To build and apply a custom function, follow these steps.
-
If you have a saved layout you would like to use, load the layout.
-
Right-click in the grid containing data you want to summarize.
A shortcut menu appears. -
Select Edit Grid Summaries.
The Grid Customizer window opens. -
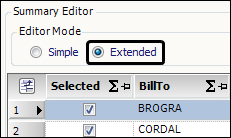
In the Summary Editor section, select Extended.
-
In the Summary Editor section, click the
sigma in the header of the column you want to summarize.
The Summary Formula Editor window opens.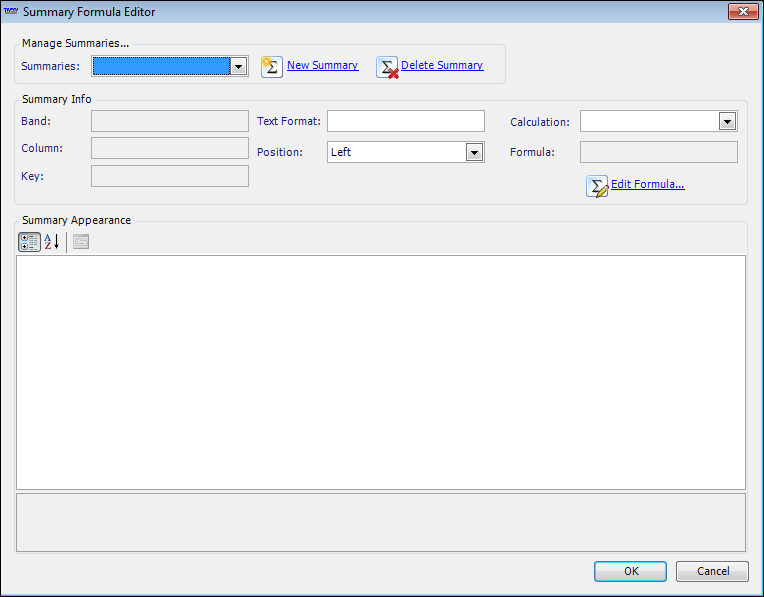
-
Click
 New Summary.
The Summary Formula Editor window fields are populated according to the column you selected.Field Definition Summaries
List of custom functions previously created for the column you selected
Band
Read-only value for the band, or row of column headers, that owns the column you selected to summarize
Column
Read-only unique identifier for the column you selected to summarize
Key
Read-only unique identifier for the type of summary being created
Summaries have a default format. However, you can enter a custom format for how the value should appear in the summary cell. Format strings must appear in braces.
For example, a column summary can show median miles in this format: 1042.5 miles.
To display a column summary with two decimal places and label the summary unit as miles, enter \{0:0.00} miles in this field. In this example:
-
The first zero is a placeholder for the summary value.
-
The colon indicates that this value should appear in the specific format to follow.
-
The zeroes following the colon represent the custom format.
-
Any text outside of the braces containing the format string will appear in the field as entered.
To format a column summary to display a value as a dollar amount, enter {0:C} in this field. The C in this format string means the value will appear in a predetermined currency format.
Position
Select the position of the summary row on the grid:
-
Left
Summary cell is left aligned in the summary row -
Right
Summary cell is right aligned in the summary row -
Center
Summary cell appears in the center of the footer -
Positioned Under Column
Summary cell is positioned under the column being summarized
Note: If selected for groups, only the summary as it applies to all groups will appear in the fixed summary row.
Calculation
Select Formula to build a custom function.
Note: This list includes the five existing simple functions. For more about existing functions, see Applying an existing function.
Formula
Displays the formula created in the Formula Builder window
-
-
Click
 Edit Formula.
The Formula Builder window opens. -
Create a formula for your custom function:
-
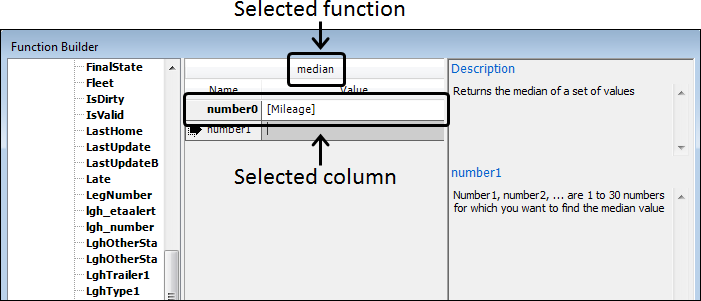
On the Functions tab, double-click on the function you want to use to calculate the summary.
The Function Builder window opens. -
Expand the Controls list to locate and double-click on the column you want to summarize with the custom function.
-
Click OK.
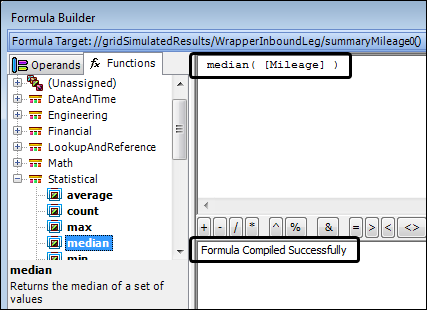
The formula construction area in the Formula Builder window displays the formula for the custom function. If the formula is valid, a message that the formula compiled successfully will appear in the section below it.Note: A message that your formula successfully compiled means only that your formula has all the necessary components and is logical. It does not guarantee a formula result.
-
-
Click OK to close the Formula Builder window.
The Summary Formula Editor window displays the formula for the custom function in the Formula field.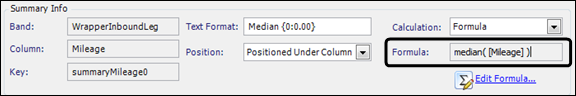
-
In the Text Format field, include the name of the function followed by ={0}. In this example, you would enter Median={0}. For more information, refer to the Text Format description.
-
In the Summary Appearance section, you can select options to choose how the summary cell appears.
Note: You also can design how summaries appear using the summary appearance settings on the Grid Customizer window.
-
Click OK.
The result of the custom function you applied appears in a summary cell below the column.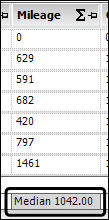
-
Click OK to close the Grid Customizer window.
The grid now displays a summary row and the result of your custom function. -
Save the grid layout.
-
If you loaded and added the summary to a saved layout, right-click on the grid and select Save Layout.
-
If this layout is a new layout, follow these steps to save it.
-
Right-click on the grid and select Save as New Layout.
The Save Grid Layout window opens. -
Enter a name for the new layout.
-
If you want the layout to be your default layout, select the Set as Default checkbox.
-
Click OK.
-
-
-
Assign the layout to users or groups of users.
Choosing where a summary appears
A summary appears by default in a row below the column you choose to summarize. You can select options for displaying summaries as column footers or headers. Use the following procedure to choose where a column summary appears.
-
Right-click in the grid to which you added a summary.
A shortcut menu appears. -
Select Edit Grid Summaries.
The Grid Customizer window opens. -
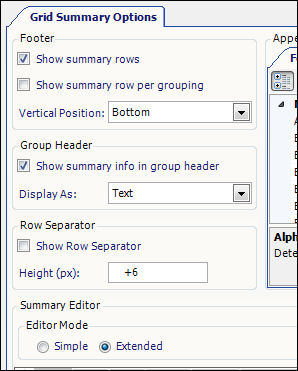
Use the options in the Footer, Group Header, and Row Separator sections to select summary location settings.
Note: Any options you choose will be reflected in the grid in the Summary Editor section.
Field Definition Show summary rows
Select to make summary rows visible.
Show summary row per grouping
Select to make a summary row appear for each group in the grid, if data is by groups in the grid.
Note: This setting displays a summary row for the group only when the group is expanded in the grid.
Vertical Position
Select the position of the summary row on the grid:
-
Bottom
The summary row appears under the data rows. -
Bottom Fixed
The summary row appears under the data rows and is visible when the grid rows are scrolled up or down.Note: If selected for groups, only the summary as it applies to all groups will appear in the fixed summary row.
-
Top
The summary row appears above the data rows. -
Top Fixed
The summary row appears above the data rows and is visible when the grid rows are scrolled up or down.Note: If selected for groups, only the summary as it applies to all groups will appear in the fixed summary row.
Show summary info in group header
Select to add summary information to the group heading, if data is arranged by groups in the grid.
Display As
Select how a group summary row appears:
-
Text
The summary appears as text following the group name. -
SummaryCells
The summary appears in a grid cell within the group header row and above the summarized column. -
SummaryCells - Always Below Description
The summary appears in a grid cell below the group header row and above the summarized column.
Show Row Separator
Select to display a row separator between the data and the summary rows.
Height (px)
Enter the desired thickness, in pixels, of the row separator.
Note: Entering a value of 0 or a negative number will result in no change in the appearance of the row separator.
-
-
Click OK to close the Grid Customizer window.
-
Save the grid layout.
-
If you loaded and added the summary to a saved layout, right-click on the grid and select Save Layout.
-
If this layout is a new layout, follow these steps to save it.
-
Right-click on the grid and select Save as New Layout.
The Save Grid Layout window opens. -
Enter a name for the new layout.
-
If you want this layout to be your default layout, select the Set as Default checkbox.
-
Click OK.
-
-
-
Assign the layout to users or groups of users.
Designing how a summary appears
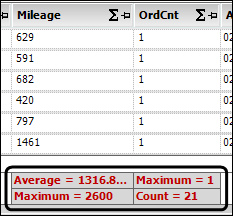
A summary appears by default in a gray cell below the column you select for summarization. You can select options to change the color and other properties of the summary row and cells.
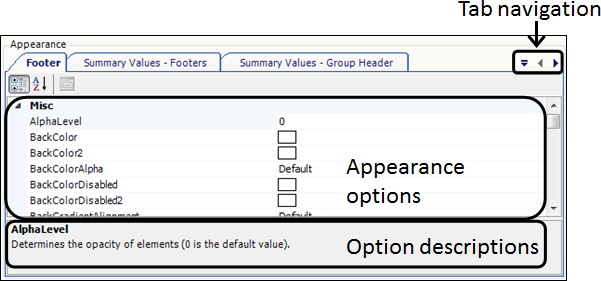
In the Appearance section of the Grid Customizer, four tabs offer options for designing how summaries appear.
Use the  button to display a list of all tabs in the Appearance section. Use the button to display a list of all tabs in the Appearance section. Use the  and and  buttons to scroll the tabs right and left. buttons to scroll the tabs right and left.
|
-
The Footer tab controls the appearance of the entire summary row footer.
-
The Summary Values - Footers tab controls the appearance of the summary cells in the summary row when it appears as a footer.
-
The Summary Values - Group Header tab controls the appearance of the summary cells in the summary row when it appears as a header.
-
The Summary Row Separator tab controls the appearance of the row separator.
To design how a column summary appears, follow these steps.
-
Right-click in the grid to which you added a summary.
A shortcut menu appears. -
Select Edit Grid Summaries.
The Grid Customizer window opens. -
Use the tabs in the Appearance section of the Grid Customizer window to control the appearance of summary information and the row separator.
-
Click OK to close the Grid Customizer window.
-
Save the grid layout.
-
If you loaded and added the summary to a saved layout, right-click on the grid and select Save Layout.
-
If this layout is a new layout, follow these steps to save it.
-
Right-click on the grid and select Save as New Layout.
The Save Grid Layout window opens. -
Enter a name for the new layout.
-
If you want this layout to be your default layout, select the Set as Default checkbox.
-
Click OK.
-
-
-
Assign the layout to users or groups of users.
Cells
You can change the appearance of summary cells, including the background color, gradient, and opacity.For example, follow these steps to change the fill color of summary cells in the grid footer:
-
Select the Summary Values - Footers tab.
-
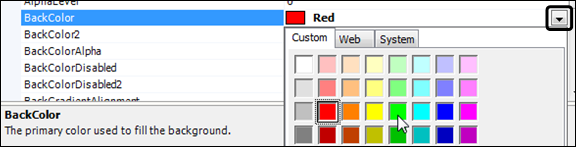
Select BackColor.
-
Click the down arrow to select a color for the summary cells.
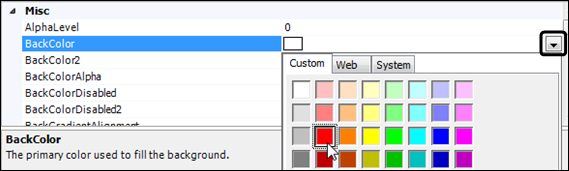
The summary cells in the Summary Editor section show the color you selected.
Cell text
You can change the properties of the text in summary cells, including the typeface, point size, and color.For example, follow these steps to change the typeface and color of the text in the summary cells in the grid footer.
-
Select the Summary Values - Footers tab.
-
Expand FontData.
-
Select Bold.
-
Use the down arrow to select True.
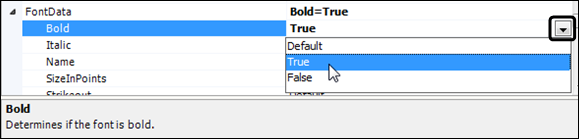
The text in the summary cells in the Summary Editor section appears in bold typeface.
-
Select ForeColor.
-
Use the down arrow to select a color for the summary cell text.
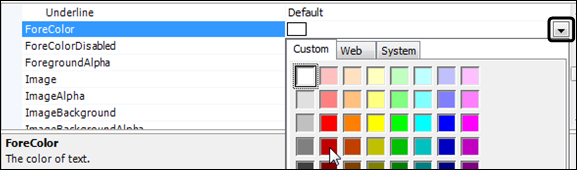
The text in the summary cells appears in boldface type and the color you selected.
Grid lines
You can change the appearance of grid lines of summary cells, including the color.For example, follow these steps to change the color of the grid lines between the summary cells in the grid footer.
-
Select the Summary Values - Footers tab.
-
Select BorderColor.
-
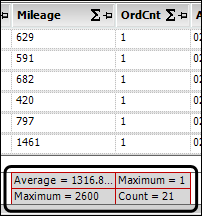
Use the down arrow to select a color for the grid lines.
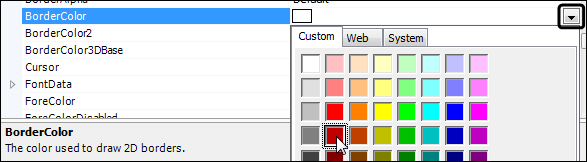
The grid lines between the summary cells appear in the color you selected.
Row separator
You can change the appearance of the separator between the summary rows and the rest of the grid. For example, follow these steps to change the color of the row separator.
| Verify that the Show Row Separator checkbox is selected in the Grid Summaries Options section of the Grid Customizer window. |
-
Select the Summary Row Separator tab.
Use the
button to display a list of all tabs in the Appearance section. Use the and buttons to scroll the tabs right and left. -
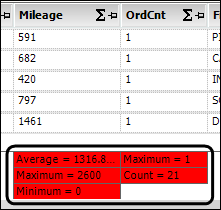
Select BackColor.
-
Use the down arrow to select a different color for the row separator.
Note: The color of the row separator is set to Red by default.
The row separator appears in the color you selected.
Deleting functions
There are a couple of options for deleting functions from a grid.
Deleting an existing function
To delete a simple grid summary, follow these steps:
-
If you have a saved layout from which you want to remove the grid summary, load the layout.
-
Right-click in the grid containing the summary you want to remove.
A shortcut menu appears. -
Select Edit Grid Summaries.
The Grid Customizer window opens. -
In the Summary Editor section, verify that Simple is selected.
-
Click the
sigma in the header of the column for which you want to remove the summary.The Select Summaries window opens.
-
Clear the checkbox for the summary function(s) you want to remove.
-
Click OK.
The summary functions you removed disappear from the summary cell(s) below the column. -
Click OK to close the Grid Customizer window.
-
Save the grid layout.
Deleting a custom function
To delete a custom function, follow these steps:
-
If you have a saved layout from which you want to remove the grid summary, load the layout.
-
Right-click in the grid containing the summary you want to remove.
A shortcut menu appears. -
Select Edit Grid Summaries.
The Grid Customizer window opens. -
In the Summary Editor section, select Extended.
-
In the Summary Editor section, click the
sigma in the header of the column from which you want to remove the summary.
The Summary Formula Editor window opens.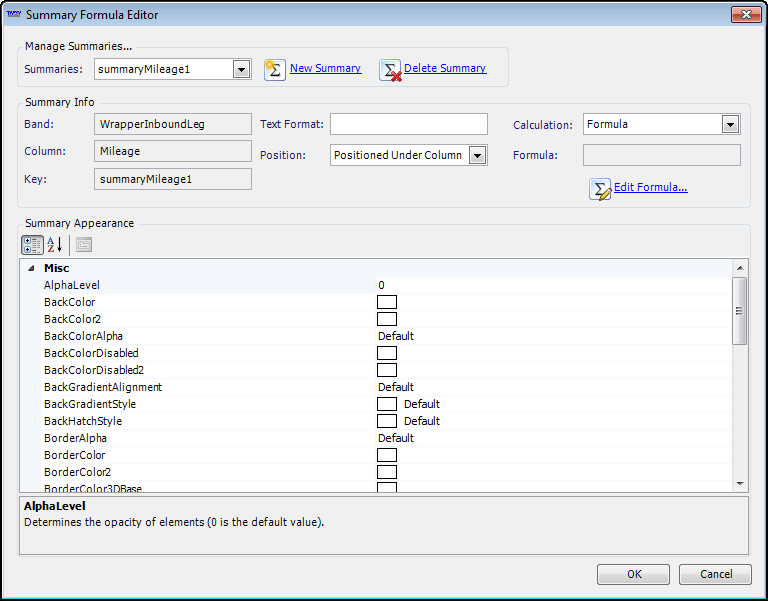
-
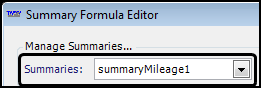
In the Summaries field, select the summary to be deleted.
-
Click Delete Summary.
-
Click OK to close the Summary Formula Editor window.
The summary functions you removed disappear from the summary cell(s) below the column. -
Click OK to close the Grid Customizer window.
The grid now displays a summary row and the result of your custom function. -
Save the grid layout.