Grouping data in a grid
You can group the entries by one column or multiple columns. Grouping creates an Excel-like outline that can be expanded and collapsed to allow you to view a large number of data rows more easily.
If the Group By Box is not visible, do the following:
-
Right-click anywhere in the data grid.
-
From the shortcut menu, select Show Group By Box.
Grouping entries by one column
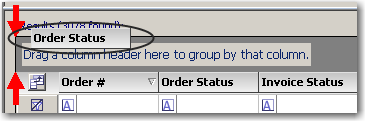
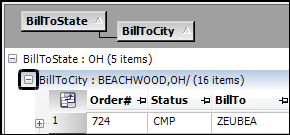
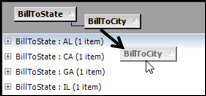
Drag the column heading up to the gray bar above the list. The arrows indicate where the group will be located.
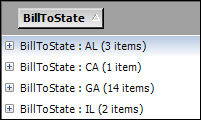
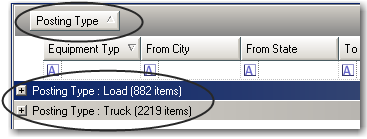
Groups are automatically collapsed and sorted alphanumerically, and the number of items in each group is shown. You can use the sorting arrows to change the sort order.
| To remove the column groupings, drag the column heading from the gray bar. |
Grouping entries by more than one column
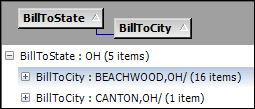
To group the entries by more than one column, expand a set of the results and then drag the second column heading next to the first in the gray bar above the list.
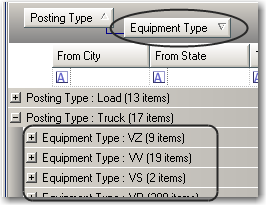
Sub groups are automatically collapsed and sorted alphanumerically, and the number of items in each sub group is shown. You can use the sorting arrows to change the sort order.
| To remove the column groupings, drag each column heading off the gray bar. |
Expanding and collapsing a grouped display
Do one of the following:
-
To expand the listing for a group, click the + next to it.
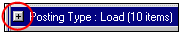
-
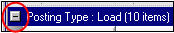
To collapse an expanded group, click the - next to it.
Removing column groups
To remove column groups for a data retrieval grid, follow these steps.
-
If grid columns display beneath a group, collapse the group so that no grid columns are visible.
This ensures that grid columns stay in their original locations when you drag column headings off the gray bar.
-
With your left mouse button, click a heading. Without releasing the mouse button, drag the column headings off the gray bar.
-
Release the mouse button.
The system removes the group.