Filtering data in a grid
You can use filters to reduce the number of records shown in a grid. This makes it easier for you to locate the information you need. Filters are conditions that serve as restrictions. When you apply filters, the system hides the records that do not meet the filter criteria you have entered. You can quickly enter filters and clear them when you are done. By default, filtering features are not visible in grids.
To enable the filtering feature in a grid, follow these steps:
-
Open the window that contains the grid you want to filter.
-
Right-click anywhere in the data grid.
A shortcut menu opens. -
Select Show Filter Row.
Immediately below the row of column headings, a filter row comes into view.
Depending on the type of data grid, you will see one of these filter rows. You can tell the difference by the presence or absence of the ![]() Condition icon.
Condition icon.
![]()
![]()
Components of the filter row:
|
Displays the list of operators for a conditional filter |
|
Text entry area where you enter the value for a filter When the data is filtered, this text area displays the filtering element.
If you move your pointer over the text box, you can see the condition applied to the filter.
|
|
Displays the values available for filtering and provides access to other filtering options |
|
Clears the filter currently in use |


|
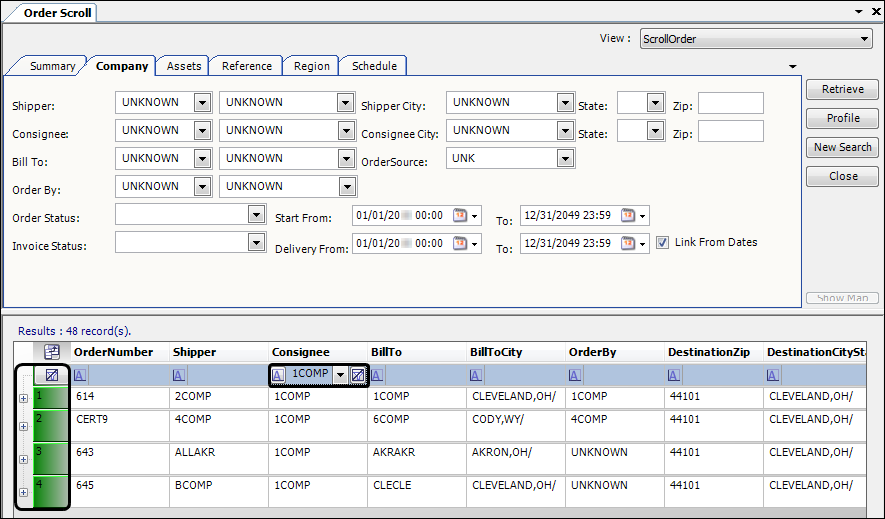
When you have [.NetMisc]ShowFilterRowChangesFromDefault=Y in your TTS50, you can quickly spot filters applied to a grid. The setting causes a green fill color to appear on the row numbers when the grid is filtered. Saving or resetting the layout removes the green fill color.
Applying text filters
Use filtering to limit the records by data in a text column, such as company or status.
|
If the filter row is not visible, do the following:
|
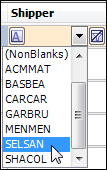
A listed value
| If the filter looks like this: | You can do this: |
|---|---|
|
|
|
|
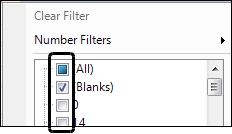
Blanks or non-blanks
| If the filter looks like this: | You can do this: |
|---|---|
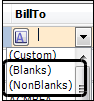
|
Click the drop-down arrow and then select:
|
|
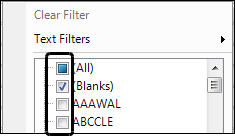
Blanks To set the filter to find only records with no data in the column:
|
|
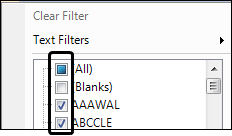
Non-blanks To set the filter to find only records that have data in the column:
|
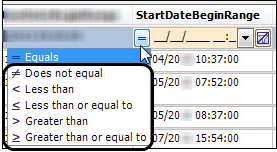
Conditional filter
Use this option to expand the filtering options in the data grid.
-
In the filter row of the appropriate column heading, do one of the following:
-
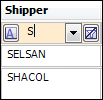
For filter rows that include the
 Conditions icon:
Click Conditions.
A list of conditions appears.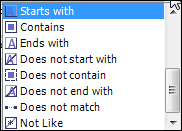
-
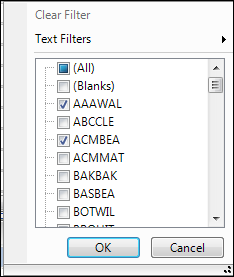
For filter rows that do not include the
Conditions icon:Click the drop-down arrow and select Text Filters.
A list of conditions appears.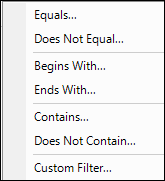
-
-
Select the appropriate condition.
The cursor moves to the text entry area. -
Enter the text you want.
Only rows that match your criteria are shown.
| Changes you make to the display remain in effect only until you close the window. To keep them, save the modified layout. |
Applying number filters
Use filtering to limit the records by data in a numeric column, such as charge amount or miles.
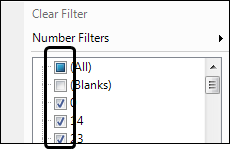
A listed value
| If the filter looks like this: | You can do this: |
|---|---|
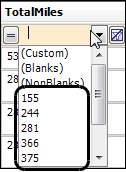
|
Click the drop-down arrow and select one of the items listed. |
|
|
Blanks or non-blanks
| If the filter looks like this: | You can do this: |
|---|---|
|
Click the drop-down arrow and then select:
|
|
Blanks To set the filter to find only records with no data in the column:
|
|
Non-blanks To set the filter to find only records that have data in the column:
|
Conditional filter
Use this option to expand the filtering options in the data grid.
-
In the filter row of the appropriate column heading, do one of the following:
-
For filter rows that include the
Conditions icon:Click Conditions.
A list of conditions is shown.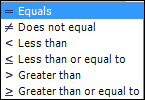
-
For filter rows that do not include the Conditions icon:
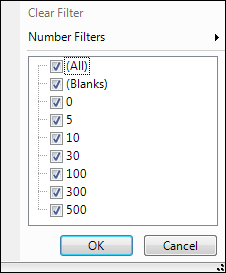
Click the drop-down arrow and select Number Filters.
A list of conditions is shown.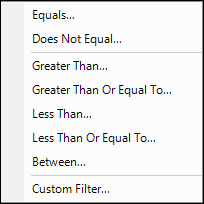
-
-
Select the appropriate condition.
The list of conditions closes and the cursor moves to the data entry area. -
Enter the value you want.
Only rows that match your criteria are shown.
| Changes you make to the display remain in effect only until you close the window. To keep them, save the modified layout. |
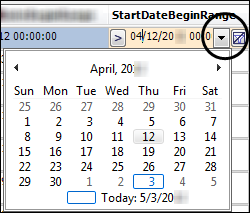
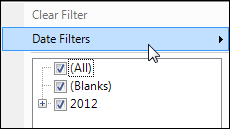
Applying date filters
Use filtering to limit the records by data in a date column, such as book date, earliest or latest arrival date.
| If the filter looks like this: | You can do this: |
|---|---|
|
Notes:
|
|
|
|
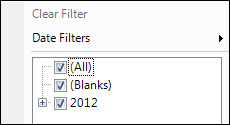
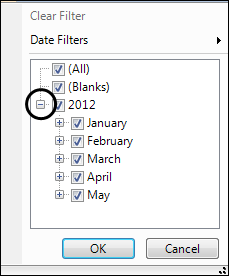
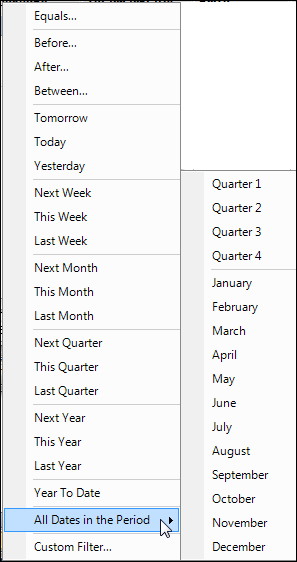
Apply date filters by periods of time:
|
| Changes you make to the display remain in effect only until you close the window. To keep them, save the modified layout. |
Applying custom filters
There may be times when you need to create a filter that involves conditions. A grid’s filter row provides access to the Custom Filter window. The window allows you to add as many conditions as needed. You can specify whether all conditions must be met, or whether at least one condition must be met.
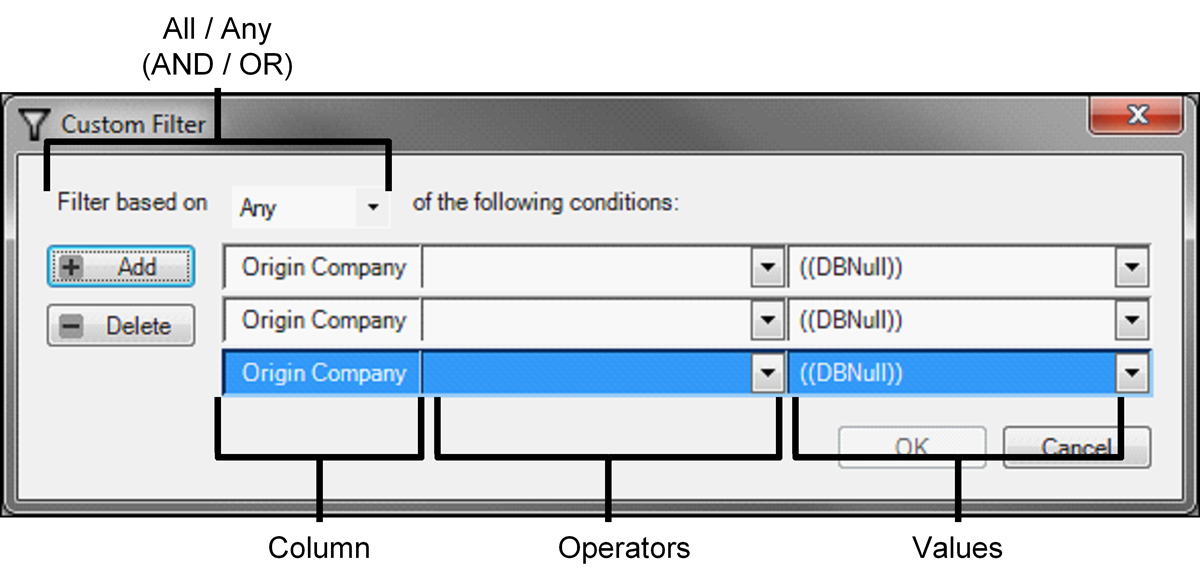
Three entries define a condition:
-
The column that contains the data that will be restricted
-
The operator used to do the comparison, such as = (equals) or > (greater than)
-
The value to which the column’s data will be compared
You can use the Custom Filter window to:
-
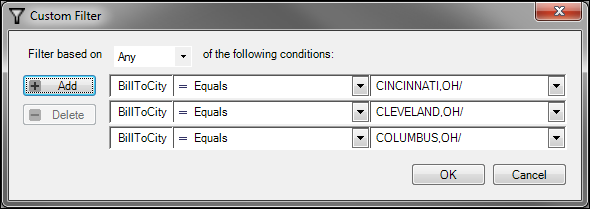
Apply multiple conditions to a filter
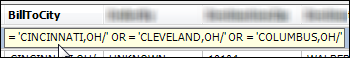
This illustration shows how you could set up a condition on the BillToCity column that would filter only those records where the BillToCity was equal to Cincinnati OR Cleveland OR Columbus.
-
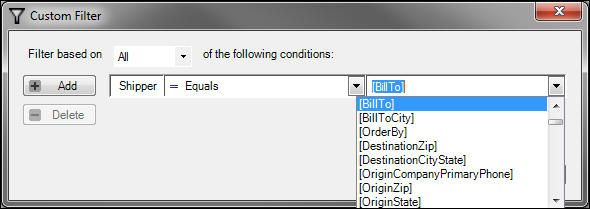
Base the result on another column in the grid
This illustration shows how you could set up a condition on the Shipper column. It filters the records to show only those with a shipper company ID that is the same as the BillTo company ID.
-
In the filter row of the appropriate column, open the Custom Filter window.
If the filter looks like this: Do this: 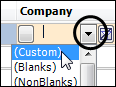
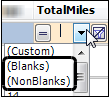
Click the drop-down arrow and select (Custom).
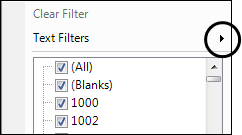
Click the drop-down arrow and, according to the type of data in the column, select:
-
Text Filters > Custom Filter
-
Number Filters > Custom Filter
-
Date Filters > Custom Filter
-
-
In the Filter based on field, select the condition’s type.
-
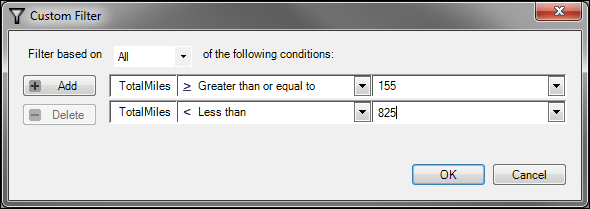
All
All conditions must be met to include the data row in the filtered list. This is the same as the Boolean AND condition. This is the default value.This sample condition would include all records that are greater than or equal to 155 miles, AND less than 825 miles in the TotalMiles column.
-
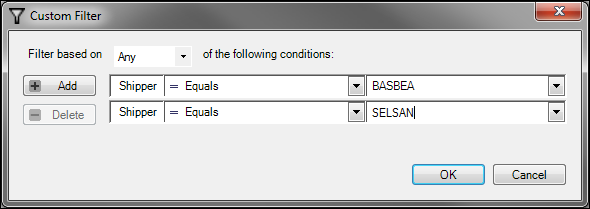
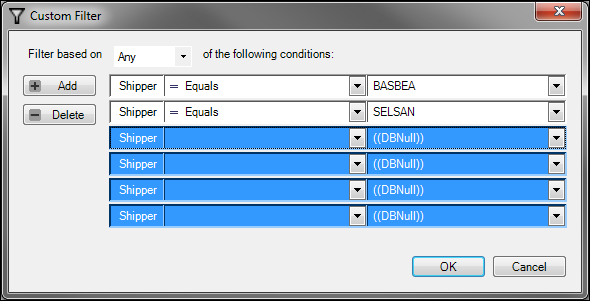
Any
At least one of the conditions must be met to include the record in the list. This is the same as the Boolean OR condition.This illustration shows a filter to return all rows when the shipper ID is BASBEA OR SELSAN.
-
-
Select an operator.
-
Enter or select the value or column name.
-
Click OK.
When you position your pointer over the filter row, the conditions you selected are displayed.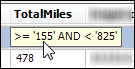
-
|
Clearing filters
You can use the icons in the filter row to clear any applied filters in a particular column or the filters in all columns.
|
If the filter row is not visible, do the following:
|
-
To clear the filter criteria in a particular column, click the
 Clear icon in the column.
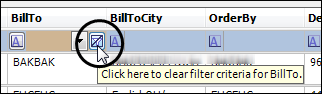
-
To clear the filter criteria in all the columns, click the
Clear All icon in the upper-left corner of the grid.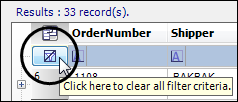
| Changes you make to the display remain in effect only until you close the window. To keep them, save the modified layout. |
Hiding the filter row
If you no longer want to use it, you can hide the filter row.
-
Right-click anywhere in the data grid.
A shortcut menu opens. -
Select Hide Filter Row.
|